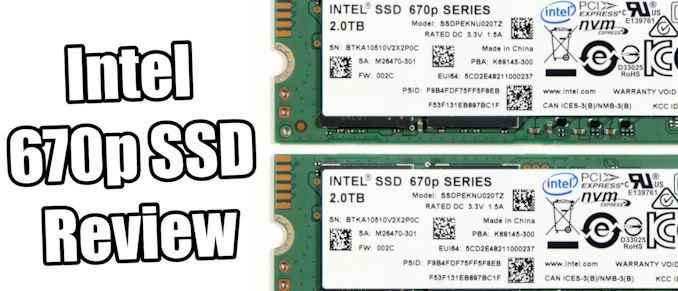
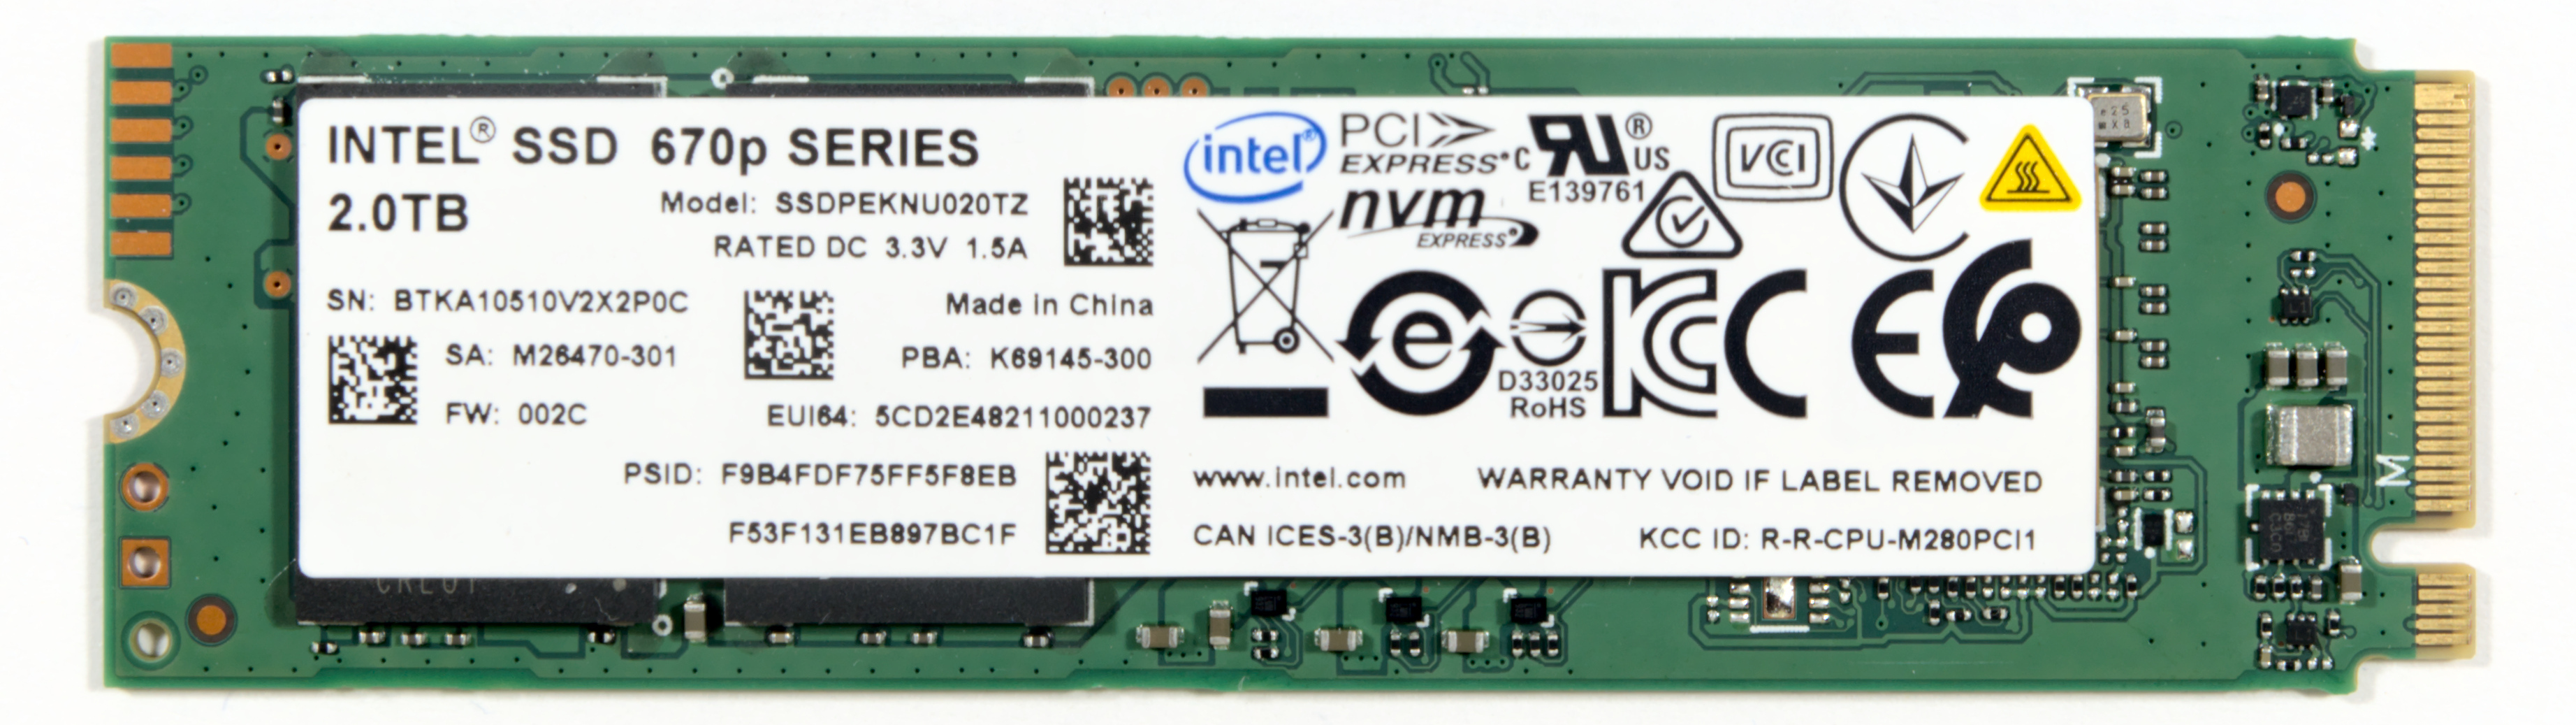
In December, Intel announced a wave of new products based around its 144-layer 3D NAND and second-generation 3D XPoint memory, however these were all enterprise focused, and we've been waiting for a consumer variant to come to market. That product has now arrived: the Intel SSD 670p.
This is Intel's third generation of consumer NVMe SSD to use QLC (four bit per cell) NAND flash memory. The new 670p is the biggest update yet, bringing not only the next generation of QLC NAND, but also a major upgrade to the SSD controller. The Intel SSD 670p is launching today as a retail product, and will be used by major PC OEMs starting in April. Based on the pricing, it looks like Intel is solely targeting OEMs with this device.
Intel's QLC Efforts: Past to Today
As a brief refresher, the first consumer QLC SSD was the Intel SSD 660p, launched in 2018 and based on their 64-layer 3D QLC and the Silicon Motion SM2263 controller. This drive (and the similar Crucial P1) proved that QLC NAND was a viable choice for entry-level consumer NVMe SSDs. Since then, that market segment has been largely divided between DRAMless TLC drives that are preferable at lower capacities, and QLC SSDs with DRAM caches that are competitive at and above 1TB.
In late 2019, Intel introduced a follow-up 665p. This upgraded to 96L QLC to provide slightly improved performance and endurance. The 512GB capacity was dropped and the firmware was tweaked to allow for larger SLC cache sizes on partially-filled drives. The 665p turned out to be a pretty short-lived drive: Intel announced in August 2020 that the 665p would be discontinued with a last-order date at the end of January 2021. Meanwhile, the 660p is still on the market.
Bringing us to the present, the new Intel 670p is rolling out with Intel's latest QLC NAND as well as a much-needed update to the SSD controller. Because the 665p is already off the market, Intel's marketing materials for the 670p take the unusual approach of comparing the 670p against the earlier 660p and largely ignoring the existence of the 665p, allowing Intel to slightly overstate the generational improvements and re-announce some advances (such as the larger SLC caches) that were already introduced by the 665p. The 670p brings back the 512GB capacity (ill-advised as it may be) and appears to be intended as a more complete replacement for the 660p.
The 670p is PCIe 3.0 x4 drive, desite it being new to market. This is because it reimagines Intel's positioning in the budget NVMe market, and going to something faster is seen as a premium play today.
| Intel SSD 670p Specifications | |||||
| Capacity | 512 GB | 1 TB | 2 TB (tested) |
||
| Controller | Silicon Motion SM2265G | ||||
| NAND Flash | Intel 144L 1Tbit 3D QLC | ||||
| DRAM | Nanya 256MB DDR3L-1866 | ||||
| Form-Factor, Interface | single-sided M.2-2280 PCIe 3.0 x4, NVMe 1.4 |
||||
| Sequential Read (MB/s) |
QD64 | 3000 | 3500 | ||
| QD1 | 2200 | 2200 | |||
| Sequential Write (MB/s) |
QD64 | 1600 | 2500 | 2700 | |
| QD1 | 1250 | 1700 | |||
| Random Read IOPS |
QD64x4T | 110k | 220k | 310k | |
| QD1 | 20k | 20k | 20k | ||
| Random Write IOPS |
QD64x4T | 315k | 330k | 340k | |
| QD1 | 54k | 54k | 54k | ||
| Warranty | 5 years | ||||
| Write Endurance | 185 TB 0.2 DWPD |
370 TB 0.2 DWPD |
740 TB 0.2 DWPD |
||
| SLC Cache | Minimum | 6 GB | 12 GB | 24 GB | |
| Maximum | 70 GB | 140 GB | 280 GB | ||
| Recommended Customer Price |
$89 | $154 | $329 | ||
As we detailed last month, Intel's new 144L QLC NAND is a considerable improvement over their 96-layer generation. Aside from the density increase, it brings slightly lower read latencies, more significant improvements to write latency and throughput, and a few other features to improve performance. The density increase should help further reduce costs, but Intel has fallen behind the rest of the industry in the layer-count race and had to adopt triple-deck string stacking in order to reach 144 layers, so their cost savings won't be as significant as competitors who should be able to reach similar QLC densities with their double-deck designs of 162-176 layers.
Terminology Info: NAND companies build 'decks' of 32-96 layers of bits, and then combine decks to get a total number of layers. Building more layers in a single deck is difficult, and so combining decks gives a higher total number of layers. Typically the companies that can put more layers in a single deck are said to have a more advanced process. Most companies use two decks to reach 150+ layers, while Intel uses 3 decks of 48 layers in this product to reach 144 layers .
The new 144L QLC has also enabled Intel to increase their write endurance ratings again. The 670p's write endurance is 23% higher than the 665p and 85% higher than the 660p, at roughly 370 write cycles. Which spread out over 5 years, works out to 0.2 drive writes per day (DWPD). More importantly, at 0.2 DWPD Intel's QLC SSDs aren't that far behind the 0.3 DWPD that most consumer TLC SSDs are rated for.
| Intel QLC SSD Write Endurance |
||||
| 512GB | 1TB | 2TB | ||
| 660p | 100 TB | 200 TB | 400 TB | |
| 665p | 300 TB | 600 TB | ||
| 670p | 185 TB | 370 TB | 740 TB | |
While the new NAND in the 670p certainly helps, it owes most of its improved performance to the upgraded SSD controller. The SM2263 controller used in the 660p and 665p is a low-cost 4-channel controller, appropriate for the entry-level market segment but seriously outdated. In particular, it is limited to IO speeds of 667 MT/s between the controller and the flash, which means that even with the fastest flash it cannot come close to saturating the PCIe 3.0 x4 host interface and struggles to go beyond about 2.4GB/s.
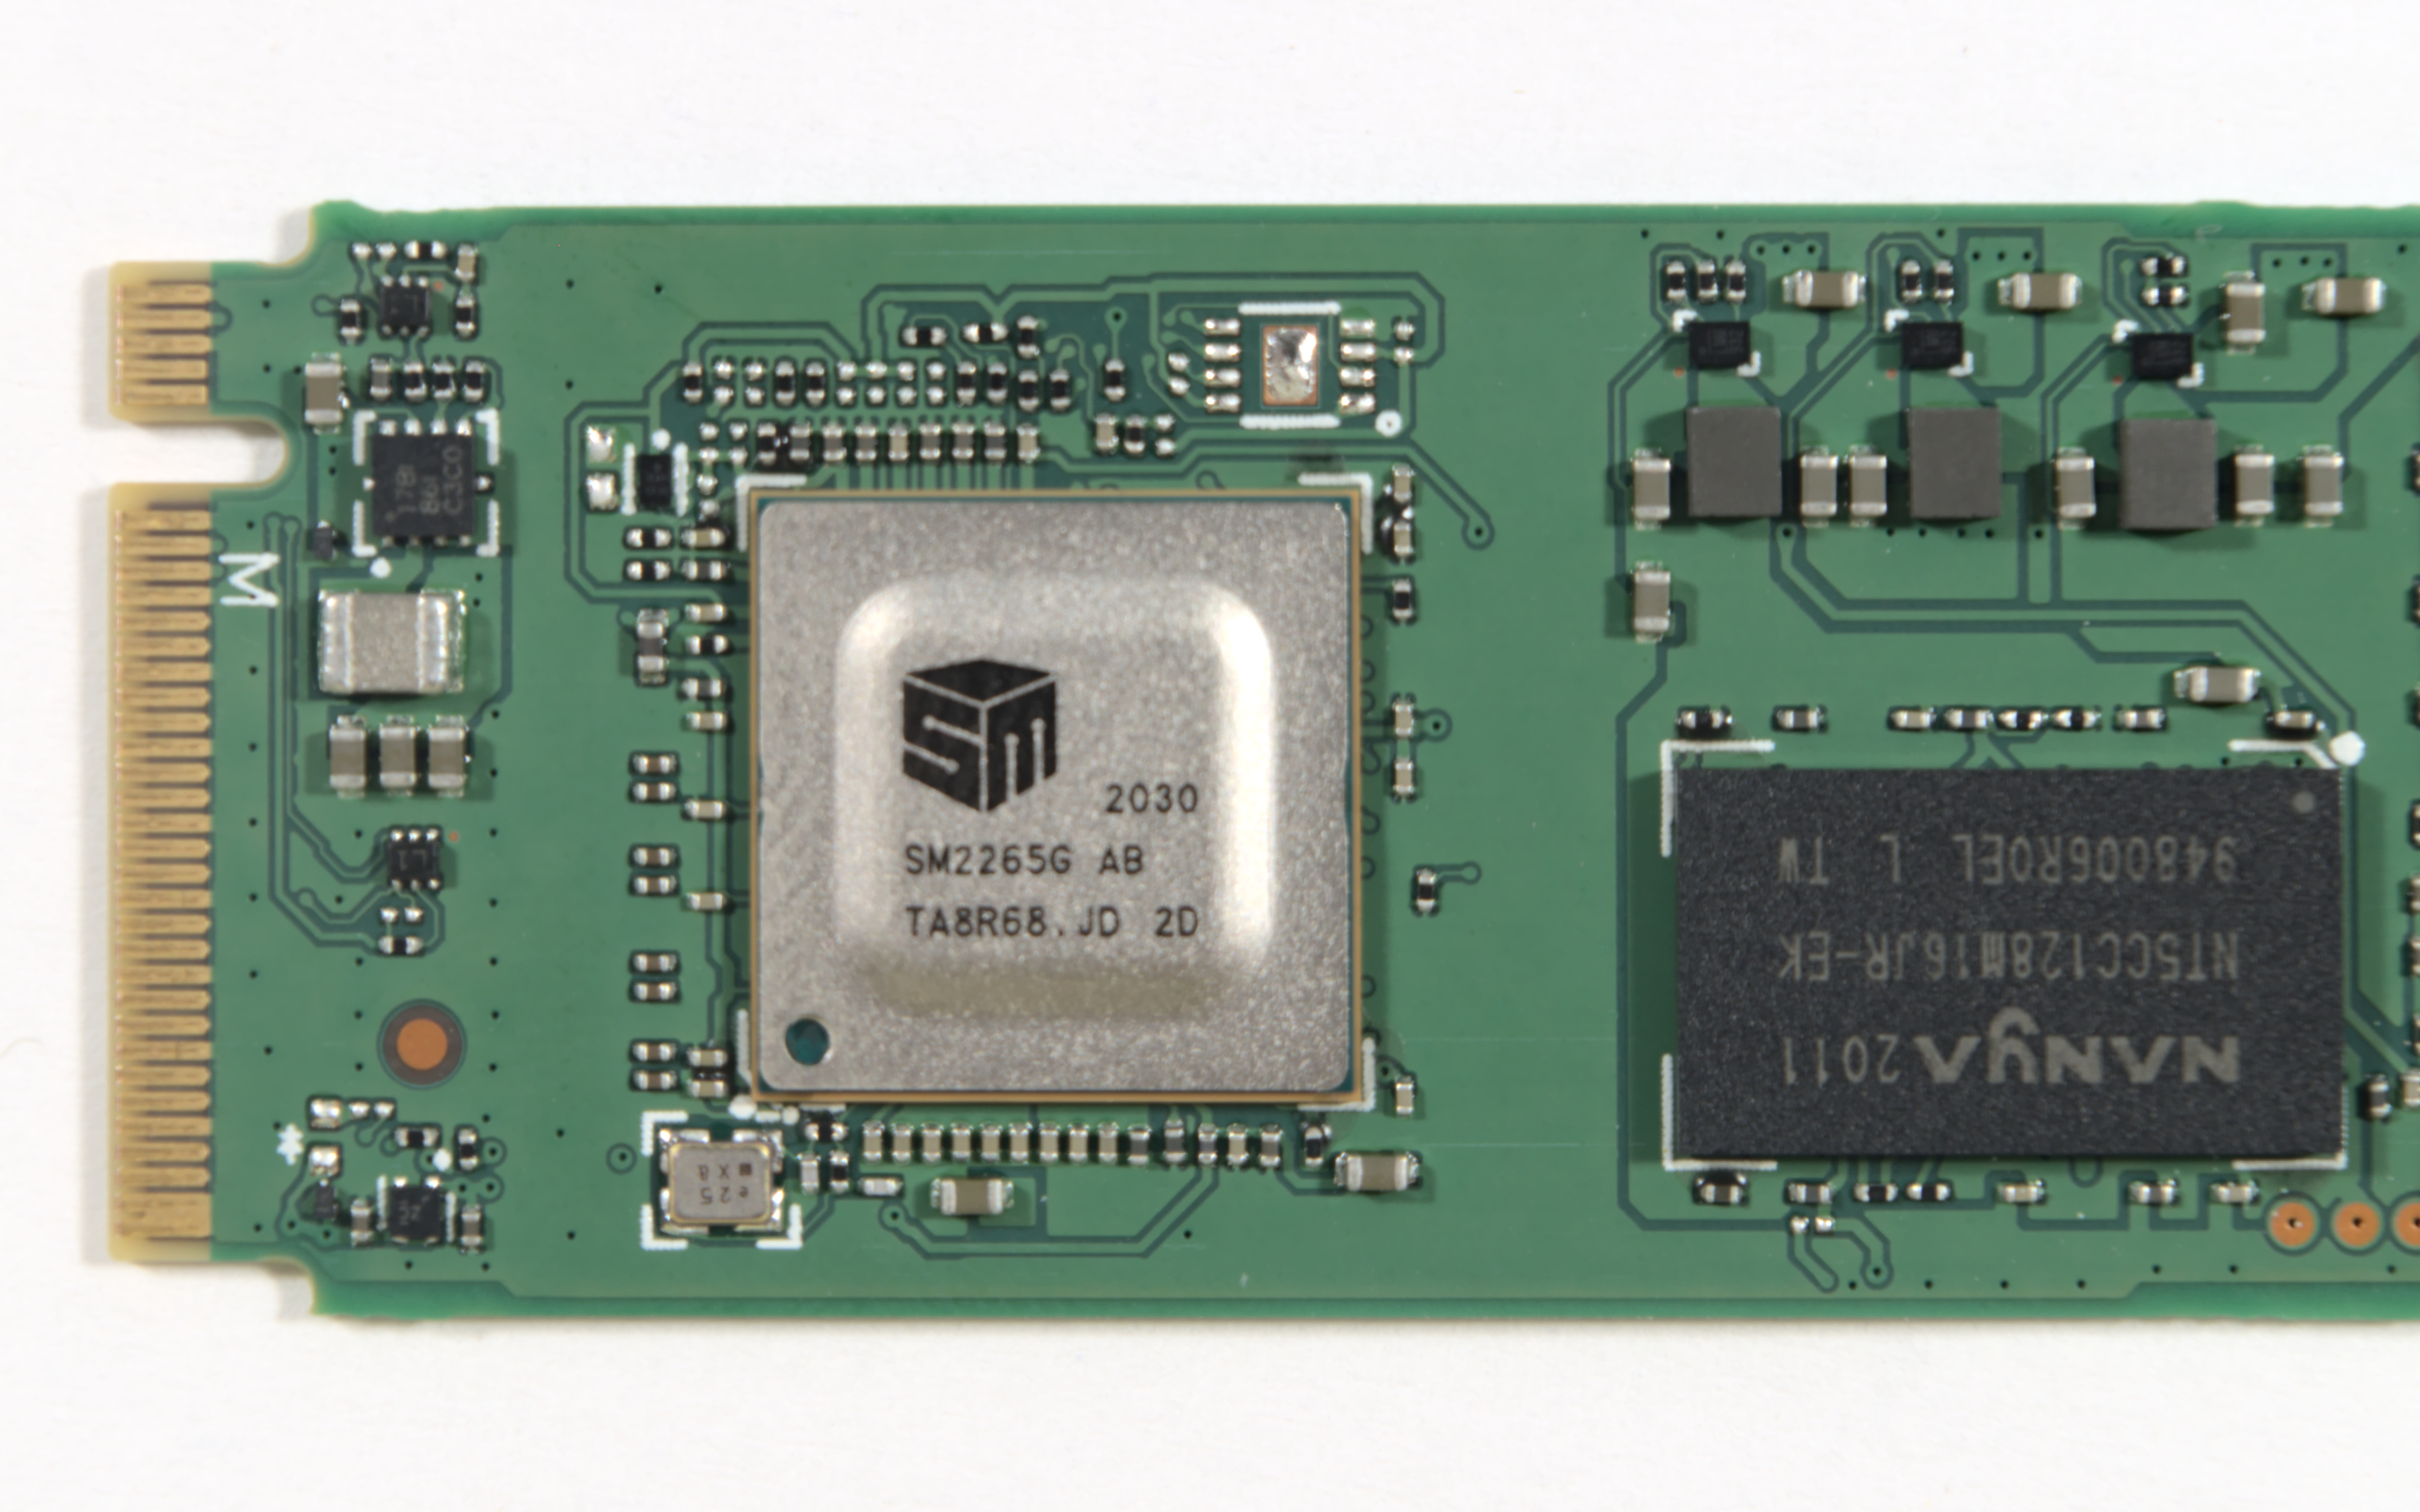
For the 670p, Intel has switched to the Silicon Motion SM2265. This controller hasn't been officially announced or documented by Silicon Motion, but a few references to it have popped up previously (though half of them are typos of the SM2256 SATA SSD controller). During the press briefing Q&A for the 670p, Intel stated the controller was a SM2262—the 8-channel controller from the same generation as the SM2263. So it's possible that the SM2265 is a more compact packaging of an SM2262 variant, much like the Phison E12S that's now used on many drives to make room for four NAND packages on the top side of the M.2 PCB.
Also possible is that the SM2265 may be more closely related to the SM2264 and SM2267 PCIe 4.0 controllers. The SM2267 is a four-channel controller and one of the first shipping PCIe 4.0 SSD controllers that is aimed at mainstream market segments rather than the high end. The package size for the SM2265 is the same as the SM2263 and SM2267 which suggests it's a four-channel controller (though the SM2267 actually has a higher pin count than the SM2262), and the performance means it would have to be supporting a higher IO speed on those four channels: closer to the SM2267's 1.2 GT/s rather than the 667 MT/s supported by the SM2263. In terms of features, the SM2265 seems to be a better fit with the SM2262/2263 generation: PCIe 3.0 instead of PCIe 4.0 and 8 queues instead of 15. The SM2265 may have inherited the upgraded error correction capabilities that Silicon Motion developed for the SM2264/2267 generation to better support QLC NAND. Overall, the SM2265 appears to be a mix of old and new, producing an updated low-cost controller that's better-suited to the remaining use cases for PCIe 3.0.
The layout of the Intel 670p is a lot less crowded than the 660p/665p: they're now using only two NAND packages to reach 2TB rather than four packages. Since the new 144L QLC is still manufactured with the same 1Tbit capacity per die, Intel's simply stacking more dies in each package. With this layout, Intel could have easily fit a controller the size of the 8-channel SM2262, but for the upcoming Optane Memory H20 they'll need to fit all these components into half the space to make room for the Optane half of that device.
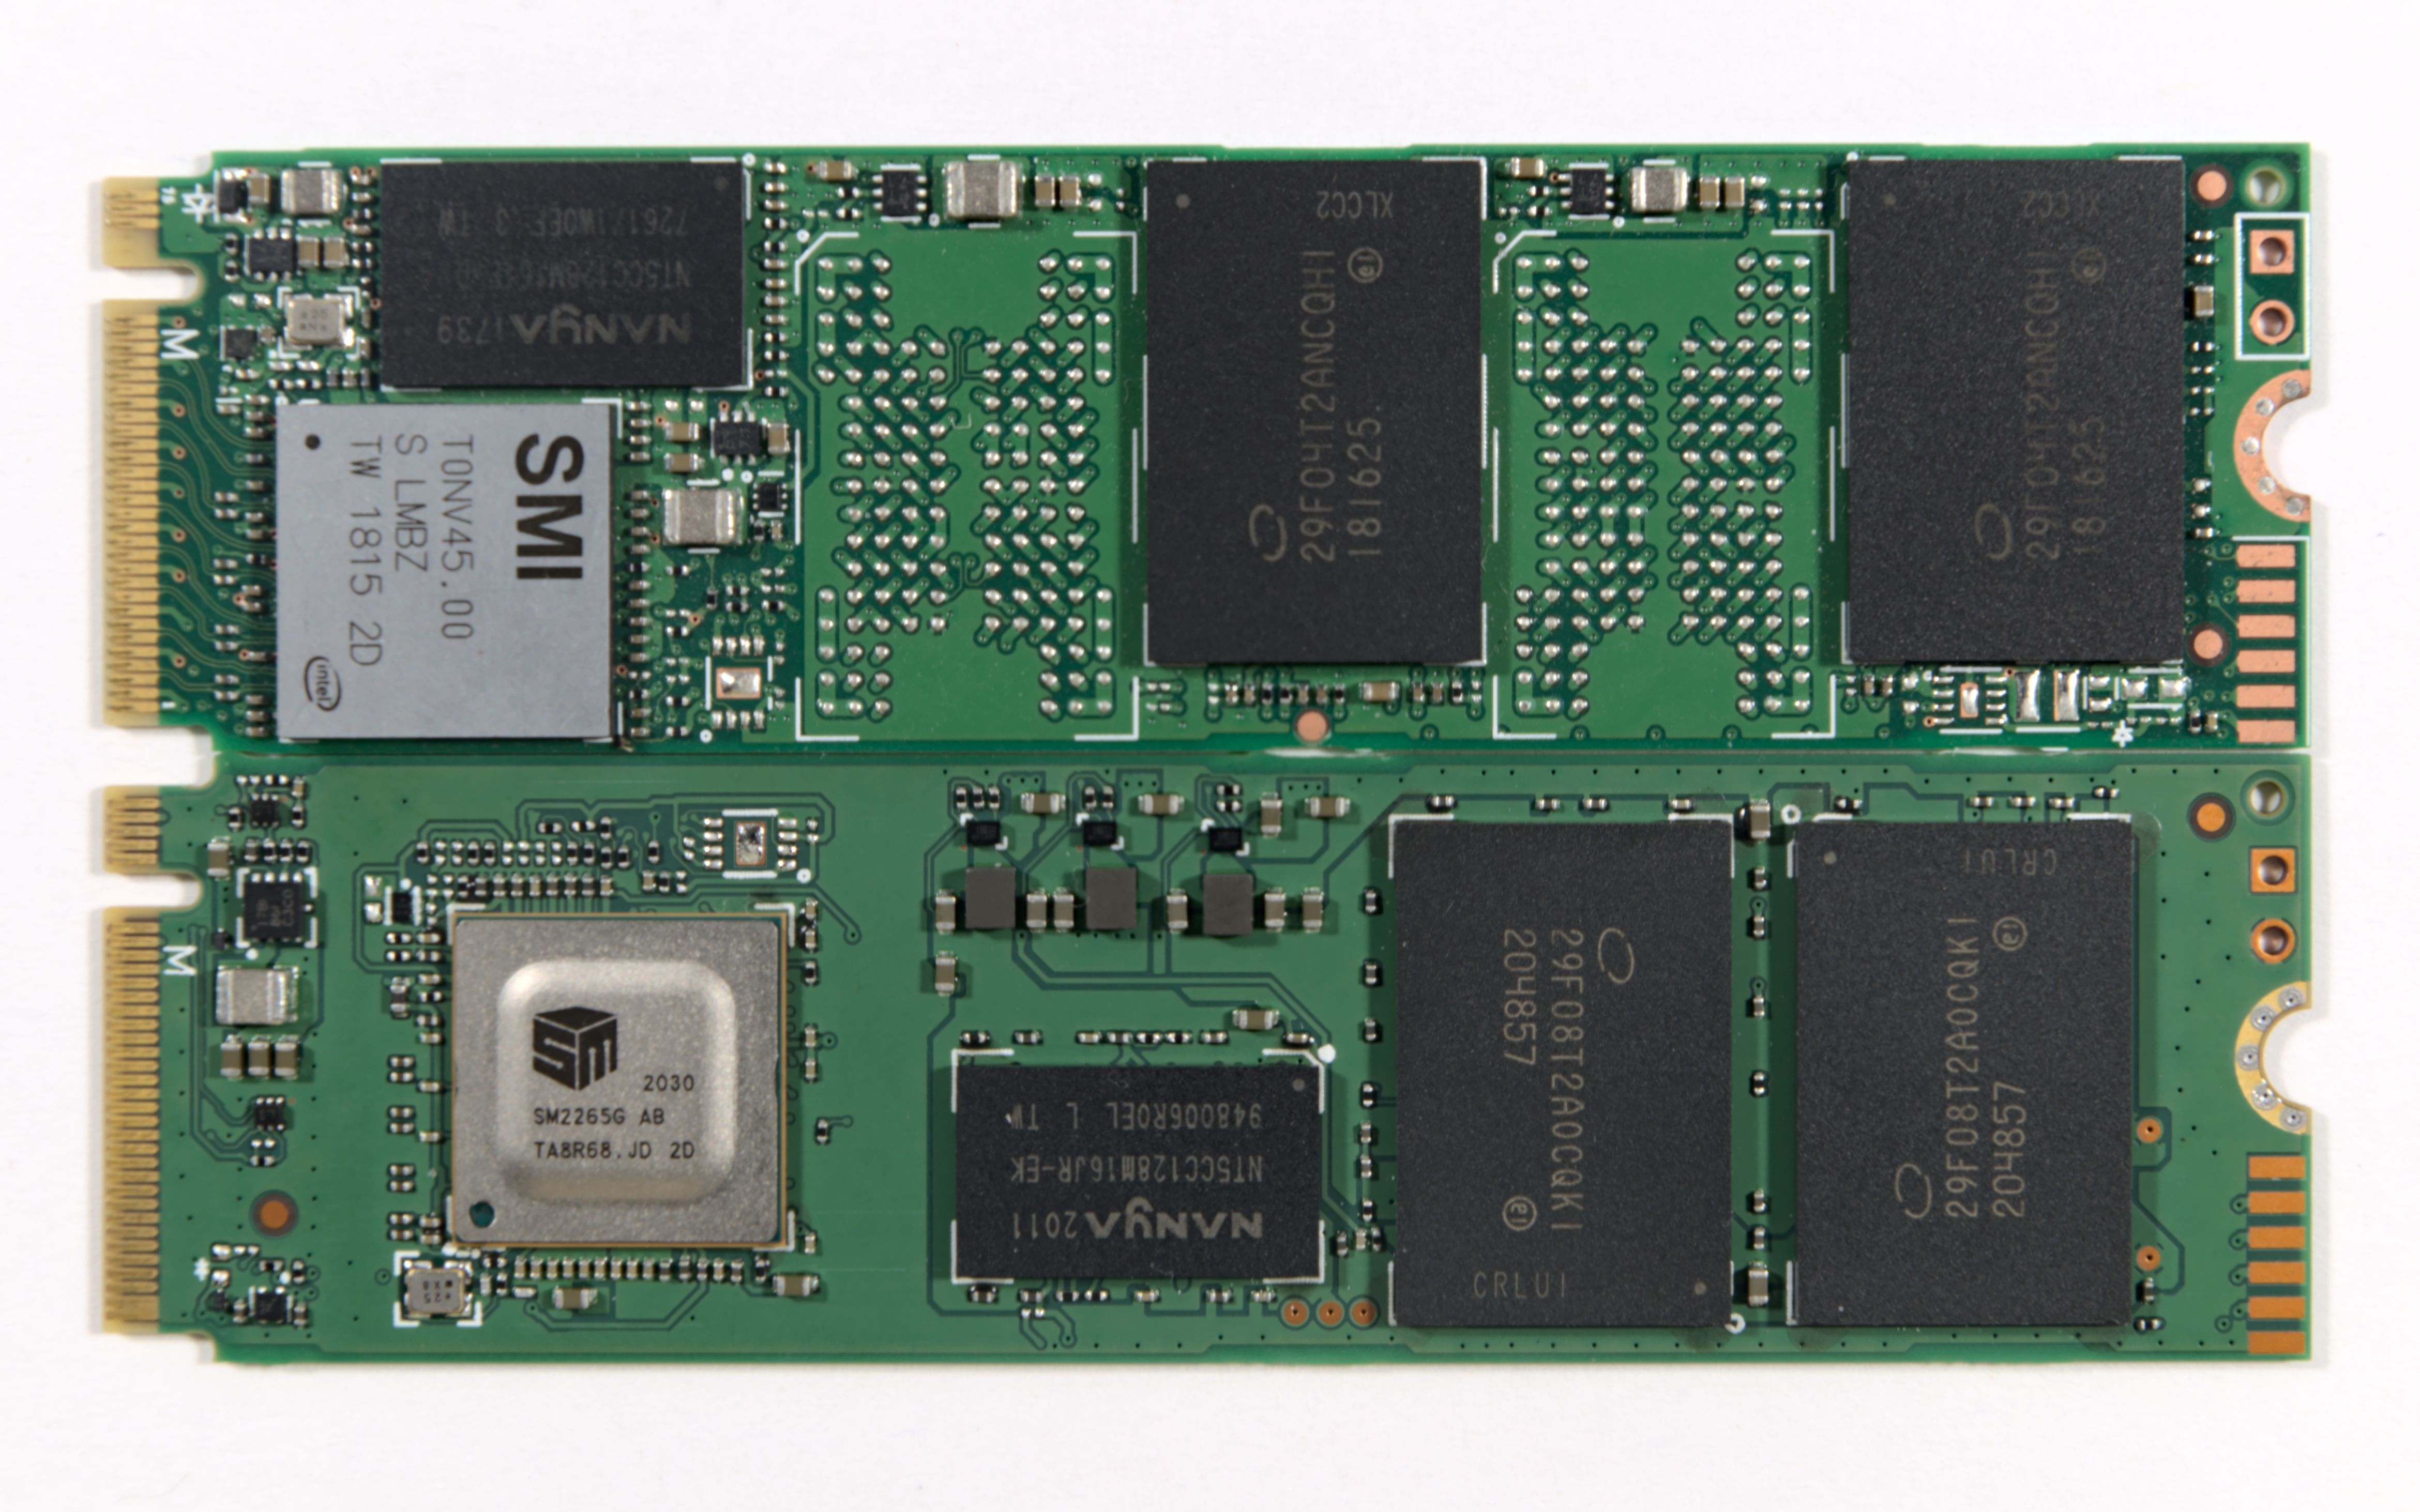 Top: 1TB Intel 660p, Bottom: 2TB Intel 670p


The Competition
Aside from test results for the earlier Intel SSD 660p, this review includes results from the following competing products:
- Phison E12 SSDs with QLC NAND, represented here by the 1TB Corsair MP400 and 8TB Sabrent Rocket Q
- Mushkin Helix-L 1TB: TLC NAND and Silicon Motion SM2263XT DRAMless controller
- HP EX950 2TB: TLC NAND and Silicon Motion SM2262EN 8-channel controller
- SK hynix Gold P31 1TB: Probably the best 4-channel NVMe SSD on the market
- Samsung 970 EVO Plus 1TB and 980 PRO 2TB: High-end TLC SSDs supporting PCIe 3.0 and PCIe 4.0 respectively
- Samsung 870 EVO 1TB and 870 QVO 1TB: The latest TLC and QLC SATA SSDs
- SK hynix Gold S31 1TB: Mainstream TLC SATA
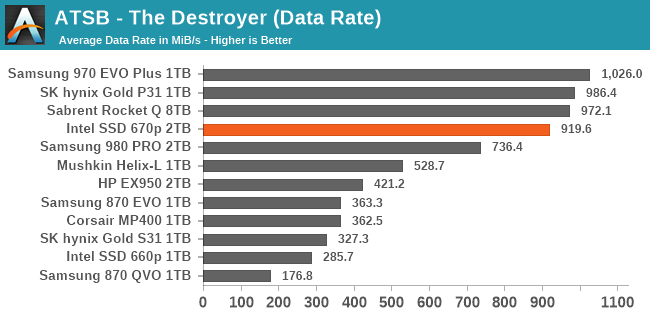
Our AnandTech Storage Bench tests are traces (recordings) of real-world IO patterns that are replayed onto the drives under test. The Destroyer is the longest and most difficult phase of our consumer SSD test suite. For more details, please see the overview of our 2021 Consumer SSD Benchmark Suite.
 |
|||||||||
| Average Data Rate | |||||||||
| Average Latency | Average Read Latency | Average Write Latency | |||||||
| 99th Percentile Latency | 99th Percentile Read Latency | 99th Percentile Write Latency | |||||||
| Energy Usage | |||||||||
The SLC cache on the 2TB Intel 670p isn't large enough for The Destroyer to operate entirely within the cache, as we saw with the massive 8TB Sabrent Rocket Q. But the big SLC cache is still enough for the 670p to score very well overall on this test, clearly outperforming all the smaller entry-level NVMe SSDs we have tested, and more than a few mainstream and high-end models as well. The 670p's biggest weakness is with 99th percentile write latency, but even that score isn't problematic.
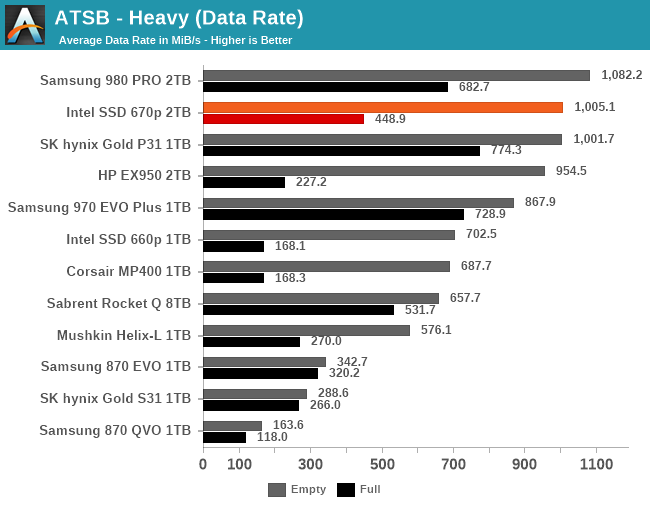
The ATSB Heavy test is much shorter overall than The Destroyer, but is still fairly write-intensive. We run this test twice: first on a mostly-empty drive, and again on a completely full drive to show the worst-case performance.
 |
|||||||||
| Average Data Rate | |||||||||
| Average Latency | Average Read Latency | Average Write Latency | |||||||
| 99th Percentile Latency | 99th Percentile Read Latency | 99th Percentile Write Latency | |||||||
| Energy Usage | |||||||||
As with The Destroyer, the empty-drive test run of the Heavy test shows that the 670p's performance can compete with good TLC drives. It's only on the full-drive test run that the QLC NAND starts to hold back the 670p. Even so, it fares better than almost all the competing entry-level drives and keeps the 99th percentile latencies down to reasonable values.
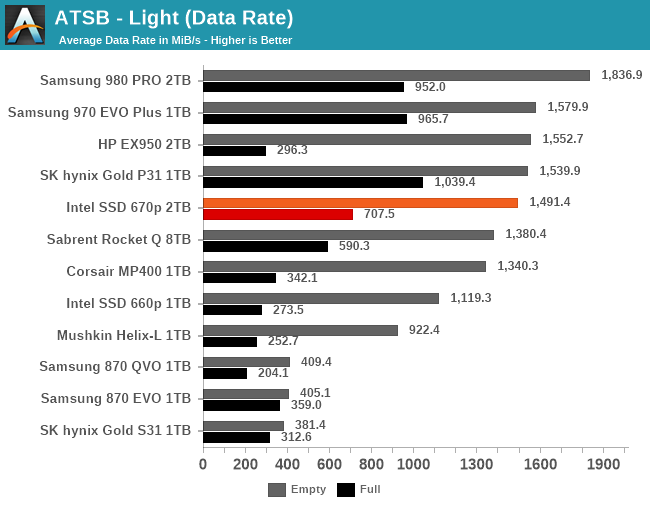
The ATSB Light test represents ordinary everyday usage that doesn't put much strain on a SSD. Low queue depths, short bursts of IO and a short overall test duration mean this should be easy for any SSD. But running it a second time on a full drive shows how even storage-light workloads can be affected by SSD performance degradation.
 |
|||||||||
| Average Data Rate | |||||||||
| Average Latency | Average Read Latency | Average Write Latency | |||||||
| 99th Percentile Latency | 99th Percentile Read Latency | 99th Percentile Write Latency | |||||||
| Energy Usage | |||||||||
On the Light test, the Intel 670p comes very close to matching the performance of mainstream TLC NVMe drives for both the empty and full drive test runs. Write latencies (average and 99th percentile) are still clearly higher than TLC drives, but not high enough to be a noticeable performance problem in storage-light real world usage. Power consumption is a bit on the high side, but that appears to be more due to the SSD controller than the downsides of QLC NAND.
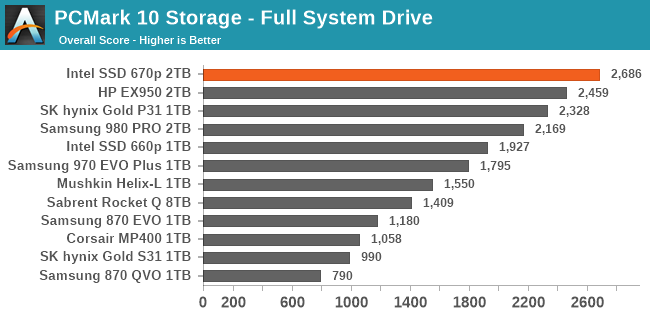
The PCMark 10 Storage benchmarks are IO trace based tests similar to our own ATSB tests. For more details, please see the overview of our 2021 Consumer SSD Benchmark Suite.
 |
|||||||||
| Full System Drive | Overall Score | Average Bandwidth | Average Latency | ||||||
| Quick System Drive | Overall Score | Average Bandwidth | Average Latency | ||||||
| Data Drive | Overall Score | Average Bandwidth | Average Latency | ||||||
Since we run the PCMark 10 Storage tests starting from an empty drive, the Intel SSD 670p is able to make full use of its large and very fast SLC cache. That puts it at the top of the charts for both the Quick System Drive and Full System Drive tests, and competitive with good TLC drives on the Data Drive test that is more geared toward sequential IO.
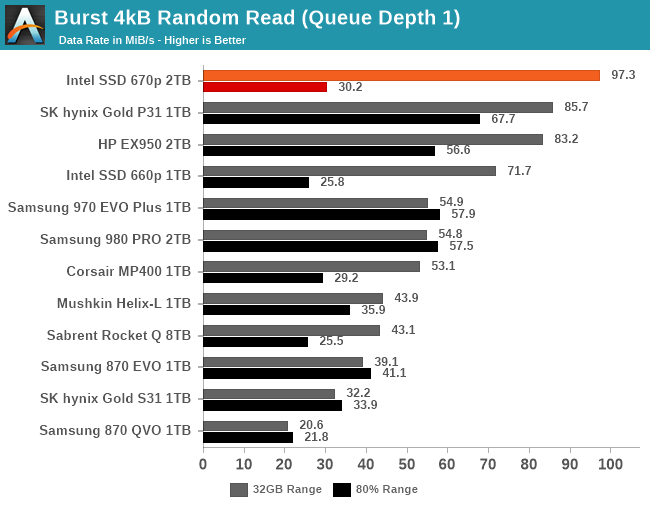
Our burst IO tests operate at queue depth 1 and perform several short data transfers interspersed with idle time. The random read and write tests consist of 32 bursts of up to 64MB each. The sequential read and write tests use eight bursts of up to 128MB each. For more details, please see the overview of our 2021 Consumer SSD Benchmark Suite.
 |
|||||||||
| Random Read | Random Write | ||||||||
| Sequential Read | Sequential Write | ||||||||
For quite a while, NVMe SSDs with Silicon Motion controllers have been delivering some of the best QD1 burst random read performance scores. The Intel SSD 670p pushes this even further, when the test is only hitting the SLC cache. When testing against an 80% full drive, the burst random read performance is faster than most other QLC drives but slower than any good TLC drive.
For QD1 random writes, the 670p is actually slightly slower than the 660p when testing a mostly-full drive, though it is again competitive with more high-end TLC drives when writing to the SLC cache. For both sequential reads and sequential writes, the 670p offers very good QD1 throughput for a PCIe 3.0 drive, and is much improved over the 660p that is seriously bottlenecked by its low-end controller.
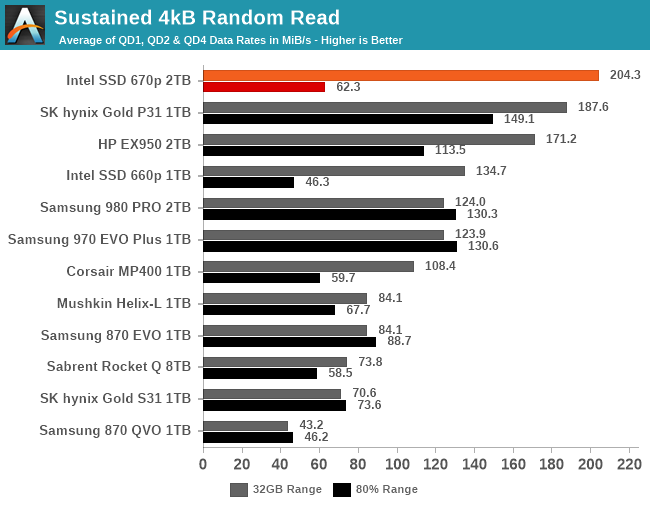
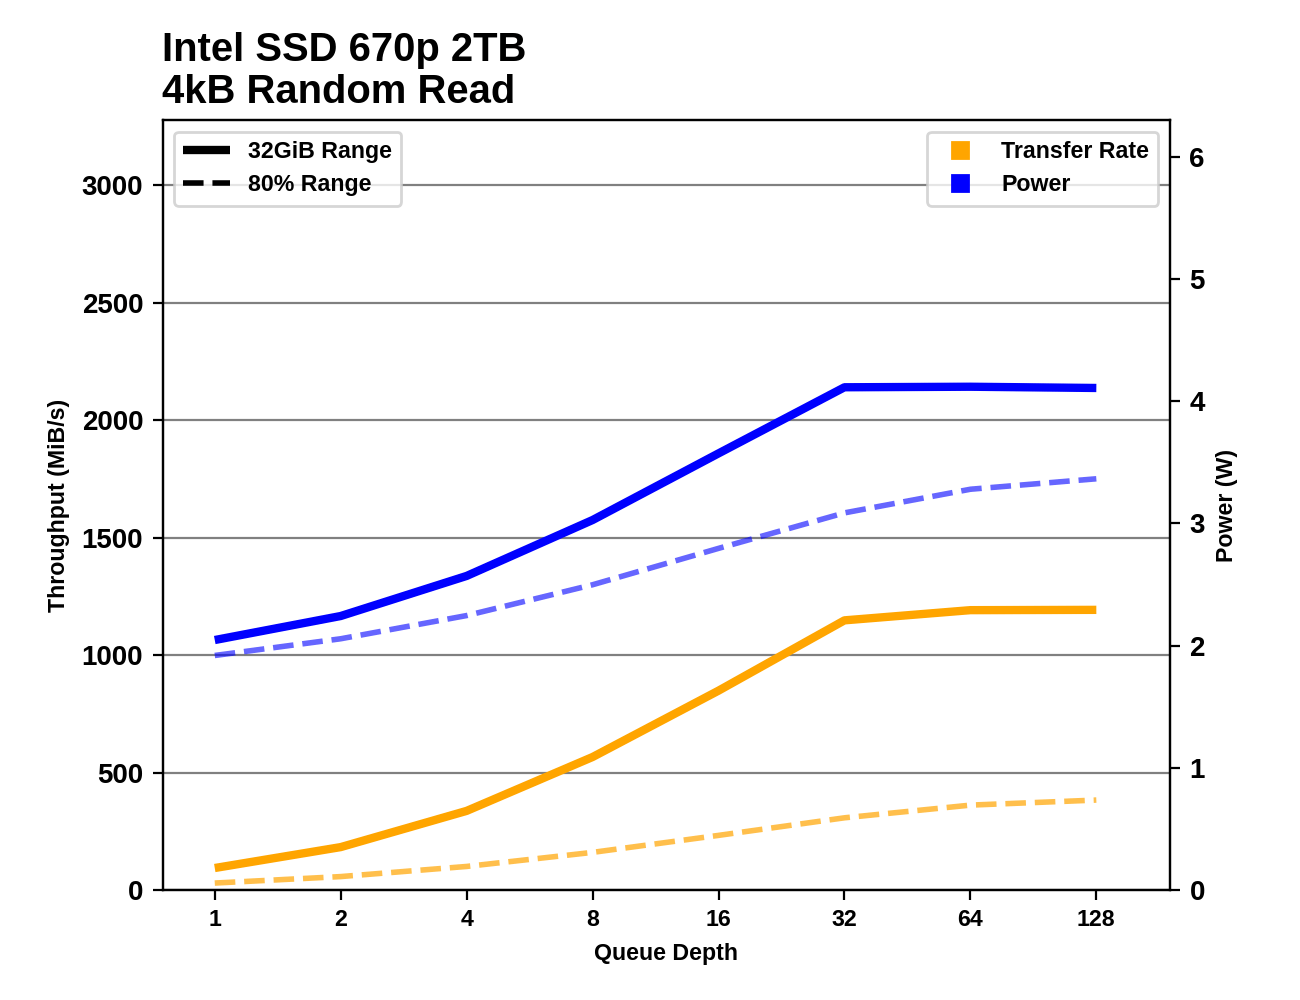
Our sustained IO tests exercise a range of queue depths and transfer more data than the burst IO tests, but still have limits to keep the duration somewhat realistic. The primary scores we report are focused on the low queue depths that make up the bulk of consumer storage workloads. For more details, please see the overview of our 2021 Consumer SSD Benchmark Suite.
 |
|||||||||
| Random Read | Throughput | Power | Efficiency | ||||||
| Random Write | Throughput | Power | Efficiency | ||||||
| Sequential Read | Throughput | Power | Efficiency | ||||||
| Sequential Write | Throughput | Power | Efficiency | ||||||
As with the burst IO scores, the longer sustained IO tests show the Intel 670p doing very well with sequential reads or writes: the performance doesn't betray the fact that it's using QLC NAND, and the power efficiency is typical of a last-generation controller. For random reads or writes, the performance at low queue depths is similarly great when testing the SLC cache, but testing across an 80% full drive knocks performance down to typical entry-level NVMe and mainstream SATA territory. Random writes in particular are disappointing on the mostly-full drive: it's slower than the 660p and the Phison E12-based Corsair MP400, though still several times faster than the DRAMless Mushkin Helix-L.
 |
|||||||||
| Random Read | |||||||||
| Random Write | |||||||||
| Sequential Read | |||||||||
| Sequential Write | |||||||||
The Intel 670p is fairly well-behaved through the sustained IO tests as the queue depth ramps up. Random reads saturate around QD32, random writes around QD8, and sequential transfers at QD2. Performance is very consistent after the drive reaches its full speed; the only big drop comes at the very end of the sequential write test on a mostly-full drive, when the SLC cache finally runs out while testing at QD128. This is pretty much never going to happen during ordinary consumer workloads.
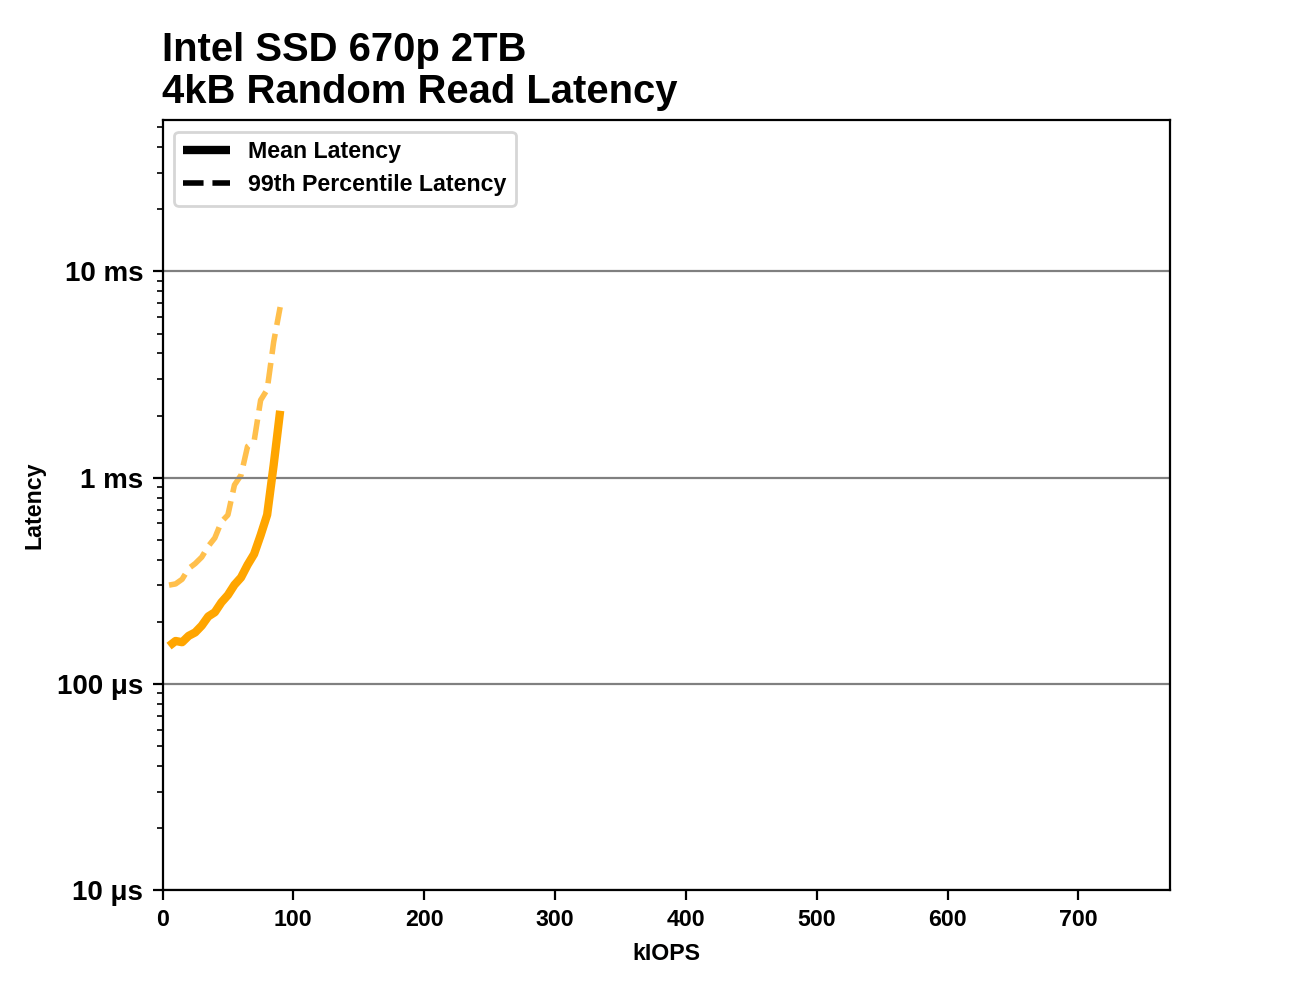
This test illustrates how drives with higher throughput don't always offer better IO latency and Quality of Service (QoS), and that latency often gets much worse when a drive is pushed to its limits. This test is more intense than real-world consumer workloads and the results can be a bit noisy, but large differences that show up clearly on a log scale plot are meaningful. For more details, please see the overview of our 2021 Consumer SSD Benchmark Suite.
 |
|||||||||
Taking a closer look at random read throughput and latency, the Intel 670p fares better than most of the other QLC drives, save for the 8TB Sabrent Rocket Q. The 670p has slightly worse performance than the DRAMless TLC Mushkin Helix-L. The throughput achieved by the 670p is similar to mainstream TLC SATA drives, but the latency is considerably higher: the SATA drives are bottlenecked by the SATA link itself, while the 670p's bottleneck is on the NAND side, which causes latency to spike as the drive is pushed to its limit.
Our benchmark suite includes a variety of tests that are less about replicating any real-world IO patterns, and more about exposing the inner workings of a drive with narrowly-focused tests. Many of these tests will show exaggerated differences between drives, and for the most part that should not be taken as a sign that one drive will be drastically faster for real-world usage. These tests are about satisfying curiosity, and are not good measures of overall drive performance. For more details, please see the overview of our 2021 Consumer SSD Benchmark Suite.
 |
|||||||||
| Pass 1 | |||||||||
| Pass 2 | |||||||||
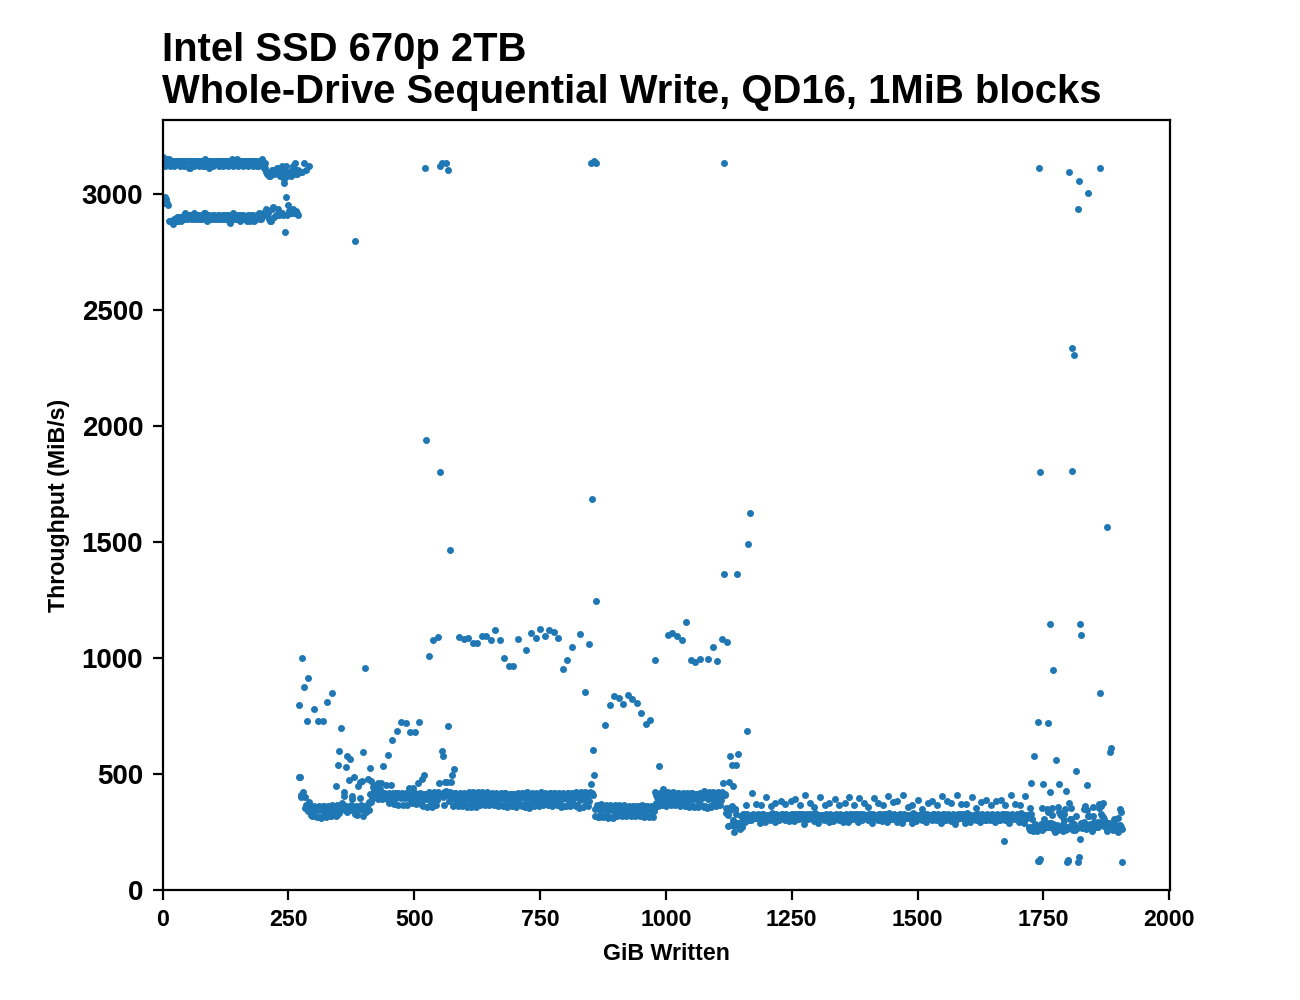
The Intel SSD 670p shows less consistent performance than the 660p during the sequential drive write. Writing to the SLC cache bounces between two performance levels, just above and just below 3 GB/s. The cache runs out more or less on schedule and performance drops down into SATA territory with sporadic outliers that are faster than normal. There's a bit of a stepped downward trend in performance as the drive approaches full. On the second pass that overwrites data on a full drive, the 670p is even more inconsistent with short bursts up to SLC write speed throughout the process.
 |
|||||||||
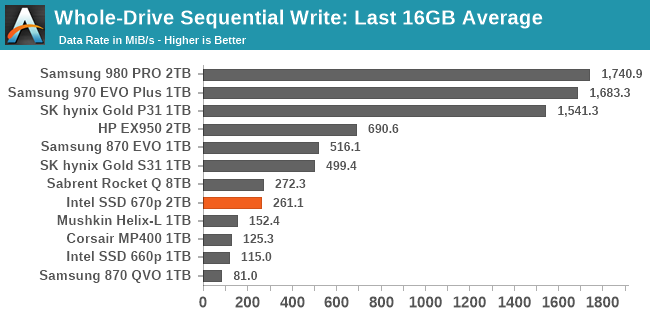
| Average Throughput for last 16 GB | Overall Average Throughput | ||||||||
The overall average write speed of the 670p is now almost enough to saturate a SATA interface. At the tail end of the filling process it does dip down to hard drive speeds, but any large sequential transfer of data onto the 670p will definitely complete more quickly than any one hard drive can handle. The controller upgrade helps some here (primarily with the SLC cache write speed), but for the most part the NAND itself is still the bottleneck, which means the smaller capacities of the 670p will not perform as well.
 |
|||||||||
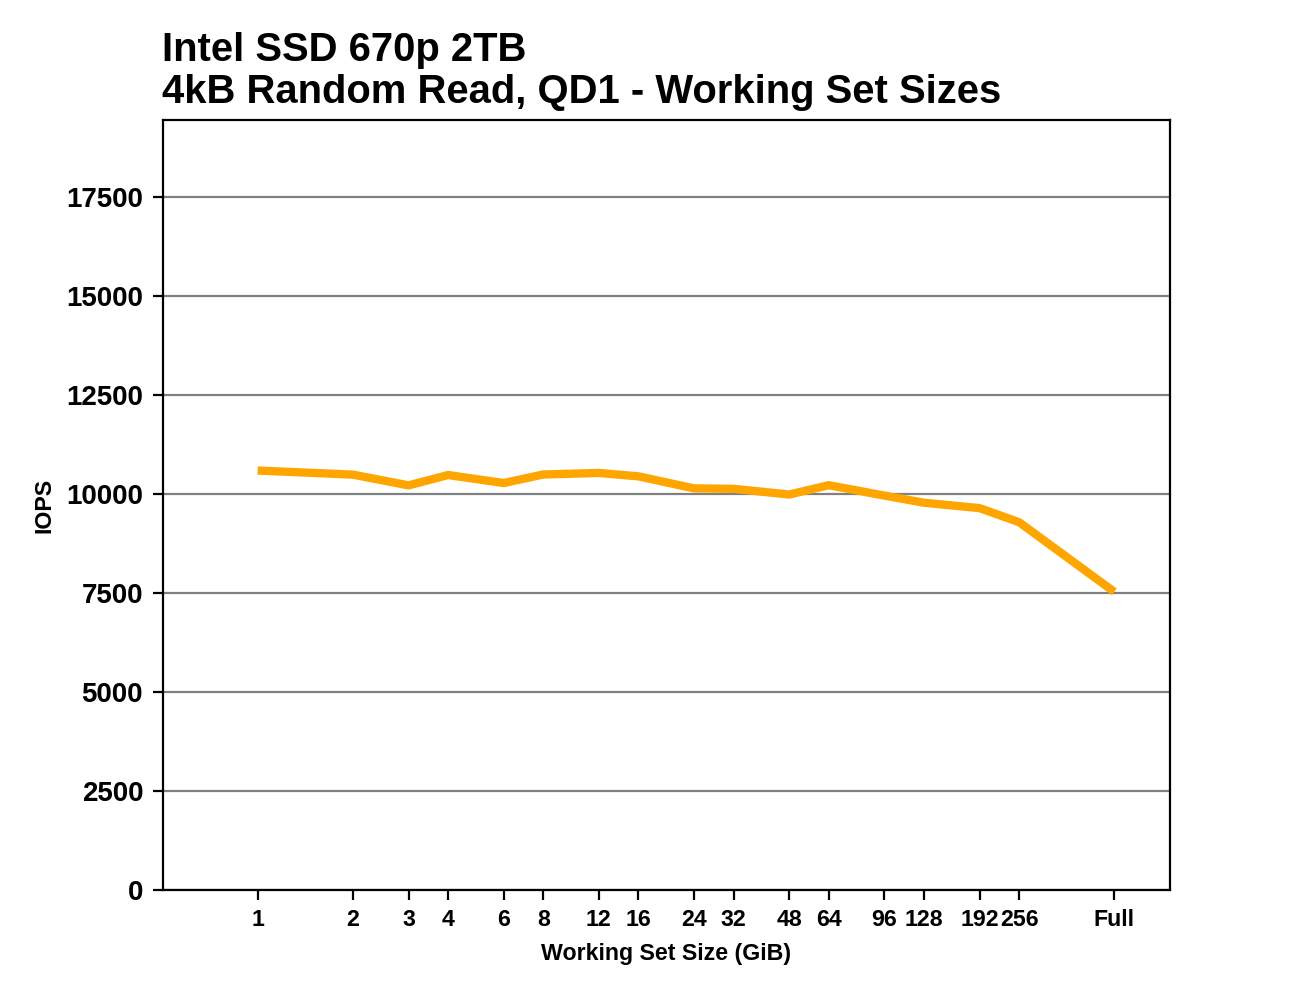
Intel is still clearly using a reduced DRAM design with the 670p rather than the full 1GB per 1TB ratio that mainstream SSDs use. The drop in performance at large working set sizes closely mirrors what we saw with the 660p, albeit with higher performance across the board thanks to the lower latency of the 144L NAND.
 |
|||||||||
| Random Read | |||||||||
| Random Write | |||||||||
| Sequential Read | |||||||||
| Sequential Write | |||||||||
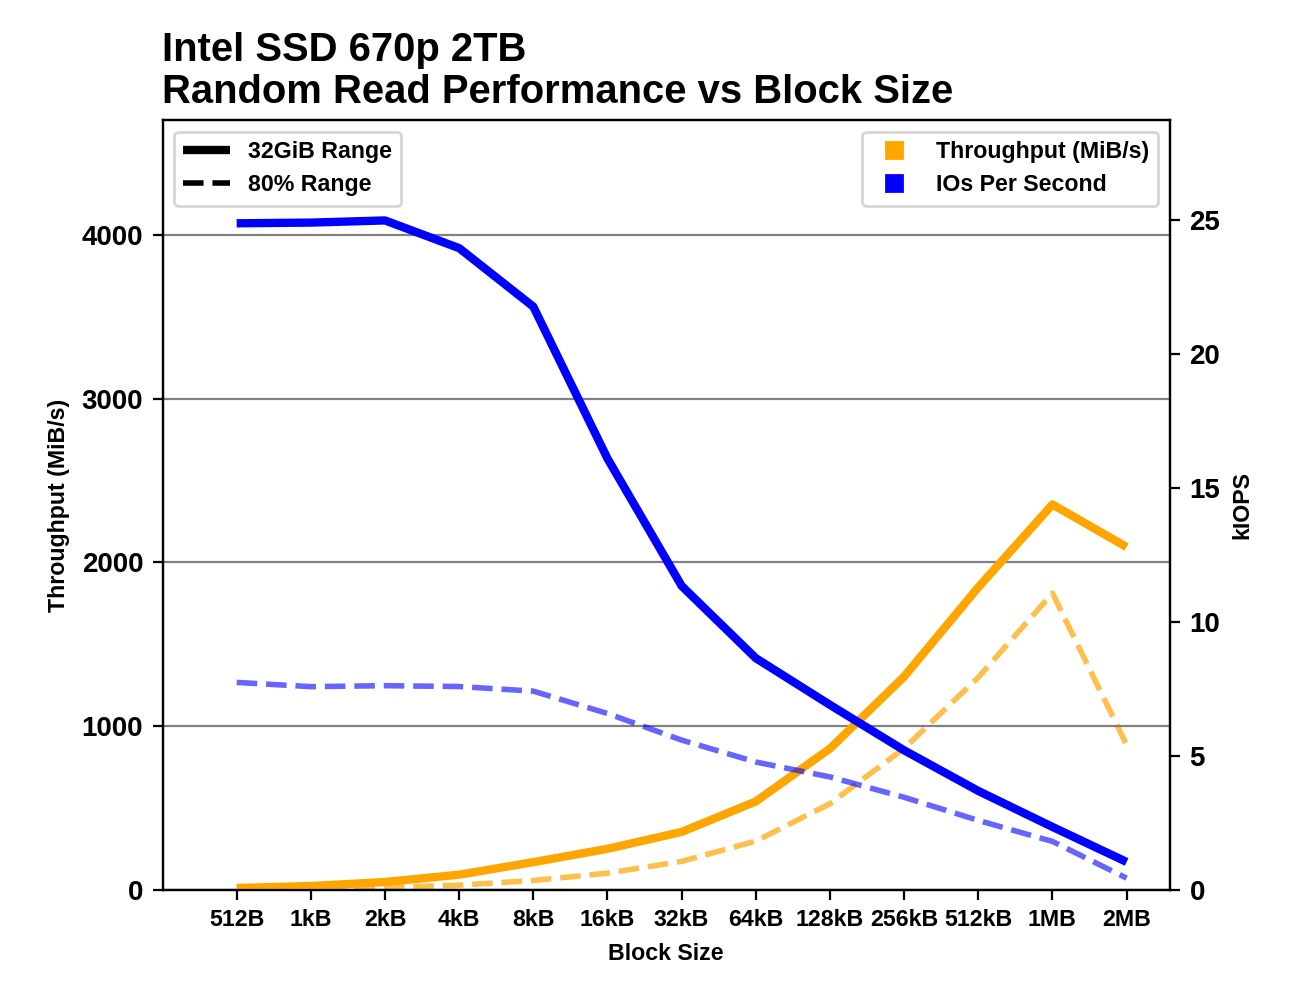
With the 670p, Intel has eliminated the IOPS penalty that random reads smaller than 4kB suffer on the 660p, but that effect is still present for random writes. The IOPS difference between the short-range tests that hit the SLC cache and the 80% full drive tests is bigger for the 670p than the 660p; the newer drive has generally improved performance, but is in some ways even more reliant on the SLC cache.
Sequential throughput on the 670p keeps increasing with larger block sizes, long past the point where the 660p saturated its controller's limits. The performance trends for both sequential reads and writes are well-behaved with little disparity between the short-range tests and the 80% full drive tests, and no indication of the SLC cache running out during the sequential write tests.
For details on our mixed IO tests, please see the overview of our 2021 Consumer SSD Benchmark Suite.
 |
|||||||||
| Mixed Random IO | Performance | Efficiency | |||||||
| Mixed Sequential IO | Performance | Efficiency | |||||||
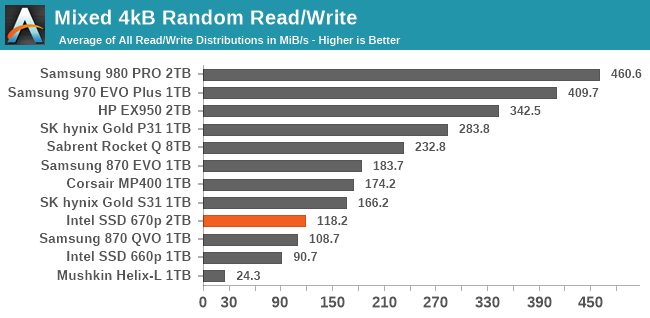
The mixed random IO test is still a significant weakness for the Intel SSD 670p; it's clearly faster than the 660p, but still far slower than either of the Phison E12-based QLC SSDs shown here (Corsair MP400, Sabrent Rocket Q). Power efficiency is consequently also poor, and the 670p falls behind even the slower Samsung 870 QVO; at least when Samsung's SATA QLC drive is being so slow, it's not using much power.
The mixed sequential IO test is a very different story: the 670p's overall performance is competitive with mainstream TLC SSDs, and even slightly higher than the HP EX950 with the SM2262EN controller. Power efficiency is also decent in this case.
 |
|||||||||
| Mixed Random IO | |||||||||
| Mixed Sequential IO | |||||||||
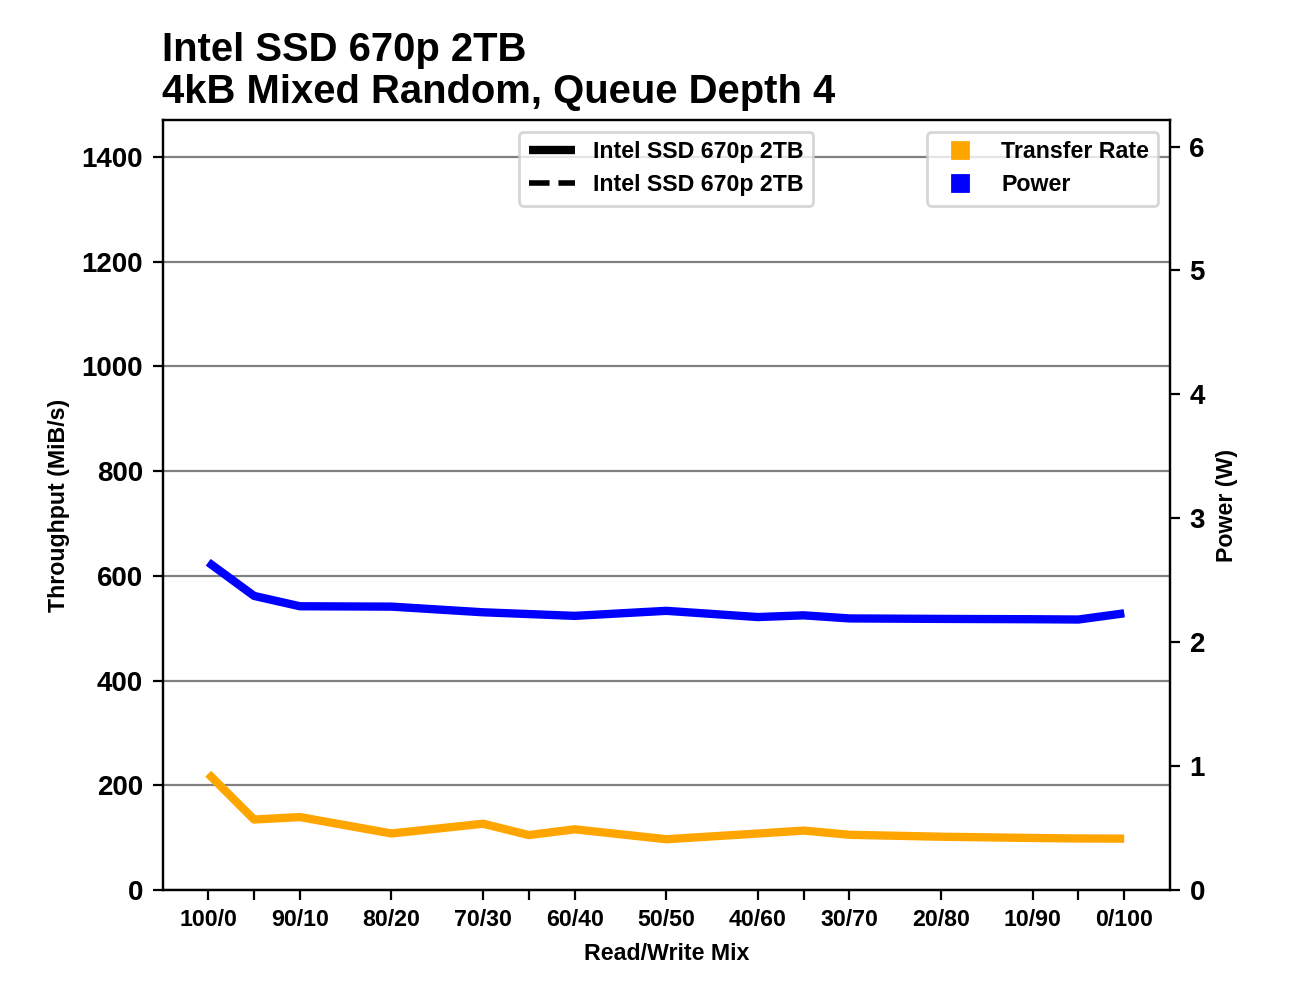
The Intel 670p's performance across the mixed random IO test isn't quite as steady as the 660p, but there's still not much variation and only a slight overall downward trend in performance as the workload shifts to be more write-heavy. On the mixed sequential IO test the 670p shows a few drops where SLC cache space apparently started running low, through most of the test the 670p maintains a higher throughput than the 660p could deliver for any workload even under ideal conditions.
Real-world client storage workloads leave SSDs idle most of the time, so the active power measurements presented earlier in this review only account for a small part of what determines a drive's suitability for battery-powered use. Especially under light use, the power efficiency of a SSD is determined mostly be how well it can save power when idle.
For many NVMe SSDs, the closely related matter of thermal management can also be important. M.2 SSDs can concentrate a lot of power in a very small space. They may also be used in locations with high ambient temperatures and poor cooling, such as tucked under a GPU on a desktop motherboard, or in a poorly-ventilated notebook.
| Intel SSD 670p 2TB NVMe Power and Thermal Management Features |
|||
| Controller | Silicon Motion SM2265G | ||
| Firmware | 002C | ||
| NVMe Version |
Feature | Status | |
| 1.0 | Number of operational (active) power states | 3 | |
| 1.1 | Number of non-operational (idle) power states | 2 | |
| Autonomous Power State Transition (APST) | Supported | ||
| 1.2 | Warning Temperature | 77 °C | |
| Critical Temperature | 80 °C | ||
| 1.3 | Host Controlled Thermal Management | Supported | |
| Non-Operational Power State Permissive Mode | Supported | ||
The Intel 670p supports the usual range of power and thermal management features. The only oddity is the exit latency listed for waking up from the deepest idle power state: 11.999 milliseconds sounds like the drive is trying to stay under some arbitrary threshold. This might be an attempt to work around the behavior of some operating system's NVMe driver and its default latency tolerance settings.
| Intel SSD 670p 2TB NVMe Power States |
|||||
| Controller | Silicon Motion SM2265 | ||||
| Firmware | 002C | ||||
| Power State |
Maximum Power |
Active/Idle | Entry Latency |
Exit Latency |
|
| PS 0 | 5.5 W | Active | - | - | |
| PS 1 | 3.6 W | Active | - | - | |
| PS 2 | 2.6 W | Active | - | - | |
| PS 3 | 25 mW | Idle | 5 ms | 5 ms | |
| PS 4 | 4 mW | Idle | 3 ms | 11.999 ms (?!) | |
Note that the above tables reflect only the information provided by the drive to the OS. The power and latency numbers are often very conservative estimates, but they are what the OS uses to determine which idle states to use and how long to wait before dropping to a deeper idle state.
SATA SSDs are tested with SATA link power management disabled to measure their active idle power draw, and with it enabled for the deeper idle power consumption score and the idle wake-up latency test. Our testbed, like any ordinary desktop system, cannot trigger the deepest DevSleep idle state.
Idle power management for NVMe SSDs is far more complicated than for SATA SSDs. NVMe SSDs can support several different idle power states, and through the Autonomous Power State Transition (APST) feature the operating system can set a drive's policy for when to drop down to a lower power state. There is typically a tradeoff in that lower-power states take longer to enter and wake up from, so the choice about what power states to use may differ for desktop and notebooks, and depending on which NVMe driver is in use. Additionally, there are multiple degrees of PCIe link power savings possible through Active State Power Management (APSM).
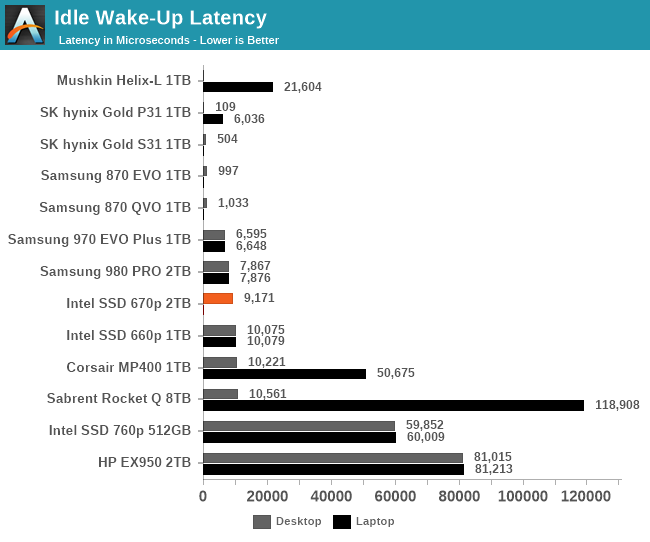
We report three idle power measurements. Active idle is representative of a typical desktop, where none of the advanced PCIe link or NVMe power saving features are enabled and the drive is immediately ready to process new commands. Our Desktop Idle number represents what can usually be expected from a desktop system that is configured to enable SATA link power management, PCIe ASPM and NVMe APST, but where the lowest PCIe L1.2 link power states are not available. The Laptop Idle number represents the maximum power savings possible with all the NVMe and PCIe power management features in use—usually the default for a battery-powered system but rarely achievable on a desktop even after changing BIOS and OS settings. Since we don't have a way to enable SATA DevSleep on any of our testbeds, SATA drives are omitted from the Laptop Idle charts.
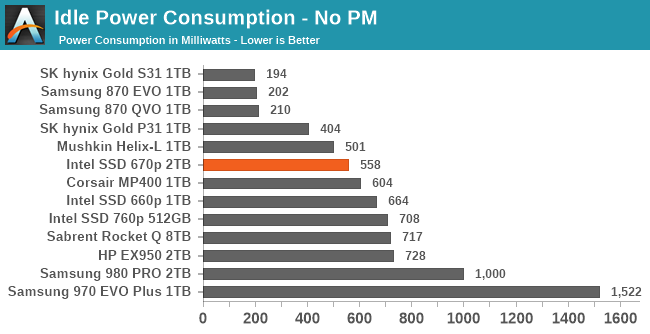
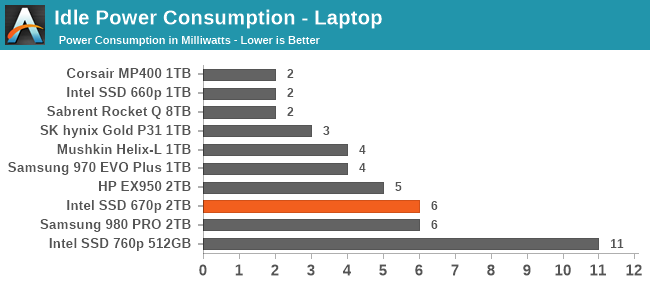
The active idle power of the 670p is clearly lower than the 660p with the SM2263 controller, but not quite as low as the Mushkin Helix-L with the DRAMless SM2263XT. So Silicon Motion has made some power optimizations with the SM2265, but it's still not in the same league as the controller SK hynix built for the Gold P31.
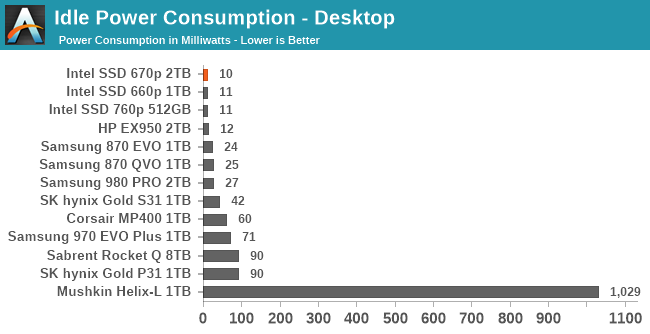
The desktop and laptop idle states we test have appropriately low power draw. However, when activating the laptop idle configuration (PCIe ASPM L1.2) the 670p would crash and not wake up from idle. This kind of bug is not unheard-of (especially with other Silicon Motion NVMe controllers), and the Linux NVMe driver has a list of drives that can't be trusted to work properly with their deepest idle power state enabled. Sometimes this can be narrowed down to a particular host system configuration or specific SSD firmware versions. But until now, this particular machine hasn't run into crashes with idle power modes on any of the drives we've tested, which is why we've trusted it as a good proxy for the power management behavior that can be expected from a properly-configured laptop. It's disappointing to see this problem show up once again with a new controller where the host system is almost certainly not at fault. Hopefully Intel can quickly fix this with a new firmware version.
The Intel SSD 670p is a great update to their consumer QLC product line. Intel hasn't eliminated the downsides of QLC NAND compared to TLC NAND, but they are continuing to reduce those downsides. With the 670p, peak performance has caught up to and in some cases clearly surpassed the performance of the QLC SSDs using the Phison E12 SSD controller. Worst-case performance has improved to the point that the larger models of 670p will no longer end up slower than hard drives during a torture test. Write endurance has increased again, and is now high enough that most consumers can stop worrying about whether QLC NAND will last long enough.

During ordinary consumer use and even some fairly heavy workloads, there won't be any of the performance problems that used to be a dead giveaway that a drive was using QLC NAND. The corner cases where performance plummets still exist, but they are getting harder to trigger with each generation. The most significant remaining performance downside to QLC is that random reads that cannot be served from the SLC cache, and in this instance they will be slower than a good DRAMless TLC drive. But even that weakness has to be put in context: the read latency outside of the SLC cache is still almost as fast as random reads from a TLC SATA SSD.
The big caveat to our conclusions is that we only tested the largest and fastest 670p model. The 512 GB model is doubtless faster than the 512 GB Intel 660p, but we still don't recommend any QLC drive smaller than 1TB. We're also not sure how compelling the performance improvements with the 1TB 670p will be: on paper it's slower than the 2TB model we tested, but not by much—especially for the benchmarks that are more likely to matter in real life.
The new 3D QLC NAND and new SSD controller introduced in the Intel 670p are both interesting from a technical standpoint. The combination works well, but both NAND and controller face an uncertain future - Intel is selling its NAND flash and SSD business to SK hynix. Intel is the last remaining NAND flash memory manufacturer using a floating gate memory cell design, which makes this 144L QLC unique within the industry. That also means SK hynix might easily decide to abandon this line of R&D and focus on the more popular charge trap flash the next time money gets tight.
The new Silicon Motion SM2265 controller provides greatly improved performance than the 660p/665p badly needed, but the SM2265 appears to be an awkward product that straddles two generations. Without even token PCIe 4.0 support, the SM2265's days are numbered. The advertising advantages of PCIe 4.0 make it very tempting to upgrade to the SM2267 controller when suitable drives are available. The SM2265 as used in the Intel 670p also fails to deliver anything like the impressive power efficiency advantages we saw with the SK hynix Gold P31 and its high-speed 4-channel controller.
The retail consumer SSD market is a bit of a mess right now: the semiconductor shortages are being felt here as well, and much of what is in stock is starting to creep up in price. Even so, the recommended customer prices Intel is launching the 670p with are way out of touch.
They're positioning the 670p in a higher price bracket than the QLC SSDs with the Phison E16 PCIe 4.0 controller. That also leaves a lot of room for reasonably-priced TLC SSDs to undercut the 670p - and not just the budget models. Basically anything significantly cheaper than a Samsung 970 EVO Plus is also cheaper than the 670p's recommended customer pricing.
Once the Intel 670p comes down to sane price ranges, it certainly has the potential to be a good product. It helps raise the bar for QLC SSDs and entry-level NVMe SSDs in general. The 670p probably can't quite come down in price far enough to match the 660p, but if it got close then it could be a very compelling bargain.
https://ift.tt/37XNTxj
Technology
Bagikan Berita Ini


0 Response to "The Intel SSD 670p (2TB) Review: Improving QLC, But Crazy Pricing?!? - AnandTech"
Post a Comment