Intel kick-started a form-factor revolution in the early 2010s with the introduction of the ultra-compact NUCs. The systems were meant to be an alternative to the tower desktops used in many applications where the size, shape, and the system capabilities were mostly unwarranted. The success of the NUCs enabled Intel to start reimagining the build of systems used in a wider range of settings.
More recently, the introduction of the Skull Canyon NUC in 2016 was Intel's first effort to make a gaming-focused SFF PC. And desktop-focused Compute Elements (essentially, a motherboard in a PCIe card form-factor) launched in early 2020 meant that full-blown gaming desktops could credibly come under the NUC banner. Also last year, the Ghost Canyon NUC9 – the first NUC Extreme – made a splash in the market with support for a user-replaceable discrete GPU. Ghost Canyon was extremely impressive, but the restrictions on the dGPU size and high-end pricing were dampeners.
Thankfully, the introduction of Tiger Lake has enabled Intel to make multiple updates in its Compute Element lineup. Incorporating some tweaks and changes learned from their Ghost Canyon experience, Intel has now put forward its flagship NUC for 2021: Beast Canyon. With a desktop-class CPU and ability to accommodate most discrete GPUs in the market, the Beast Canyon NUC promises a lot. Does it manage to exorcise the ghosts of its predecessor? Our review below provides some answers.
Intel's lineup of gaming-focused NUCs started with the Performance series (Skull Canyon NUC6i7KYK and Hades Canyon NUC8i7HVK), before moving up the ladder to the Extreme series (Ghost Canyon NUC9i9QNX). The Beast Canyon, announced at the 2021 Computex, is taking over the flagship mantle this year. The important updates over the Ghost Canyon NUC include:
- Support for 65W desktop-class CPUs in the Compute Element (compared to the 45W mobile workstation-focused CPU in the Ghost Canyon's Compute Elements)
- Increased chassis dimensions to accommodate larger discrete GPUs
- 10nm Tiger Lake CPU with new micro-architectural improvements for performance and power-efficiency
- Support for a richer set of I/Os (including PCIe Gen 4)
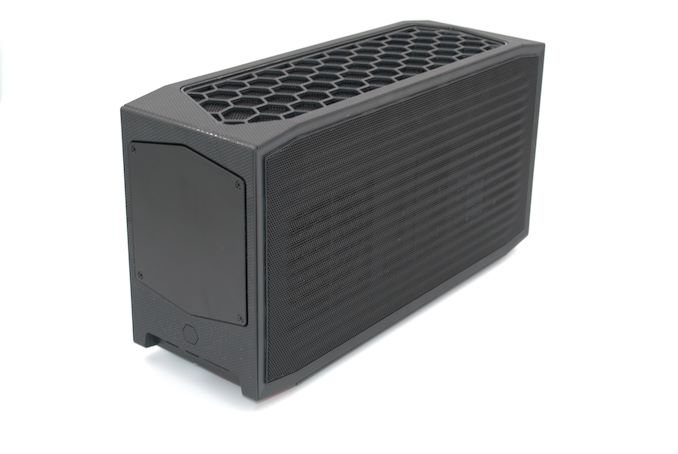
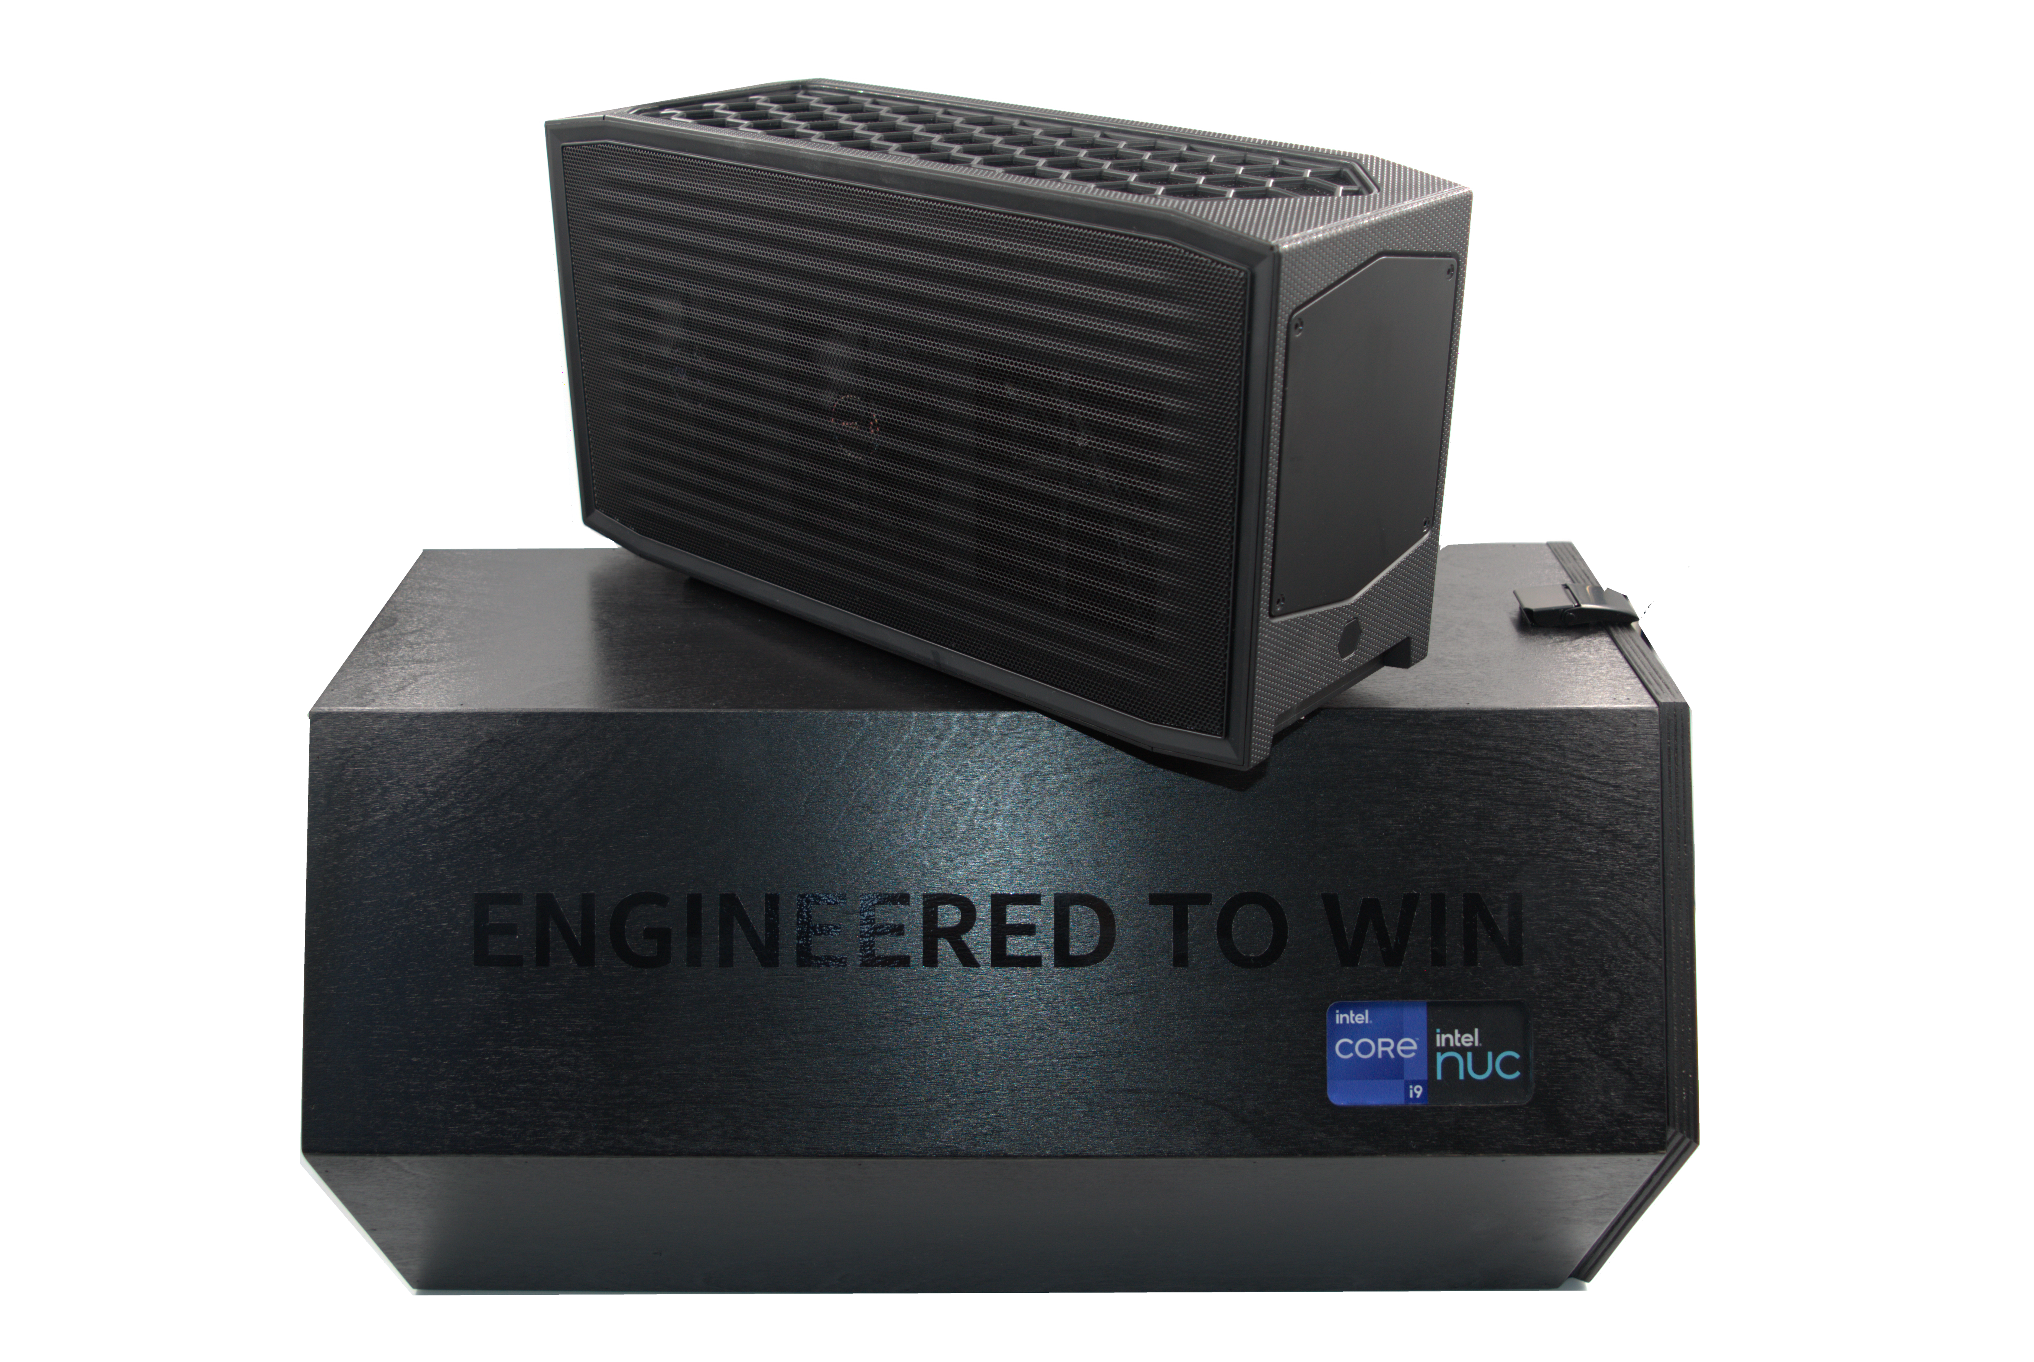
Intel supplied us with an engineering sample of the high-end SKU in the Beast Canyon line - the NUC11BTMi9 sporting the NUC11 Extreme Compute Element (NUC11DBBi9). This Compute Element is housed in a 357mm x 189mm x 120mm chassis. Traditionally, NUCs have been associated with the ultra-compact form-factor (100mm x 100mm in a 0.63L or 0.42L chassis). The introduction of the Skull Canyon and subsequent Hades Canyon NUCs created yet another class of 0.7L to 1.2L NUCs, and last year's Ghost Canyon took it up to approximately 5L. The need to accommodate the cooling solution of a more powerful Compute Element, along with the ability to accept large dGPUs contribute to the 8L volume of the Beast Canyon NUC chassis. This is still within the realm of SFF PCs - an adult can still single-handedly carry the unit around. Other important SFF aspects such as the in-built PSU are carried over from the Ghost Canyon NUC.
Intel's NUC lineup has traditionally included board and kit variants, allowing its partners to provide value additions (such as a passive chassis or additional I/O ports in the end system). Kits (other than the ones that come with a pre-installed OS) require the end-user to add storage, DRAM, and install an OS to complete the system. Intel plans to sell two varieties of the Beast Canyon NUC - the NUC11BTMi9 and the NUC11BTMi7. These two NUCs are kits based on the Driver Bay line of Compute Elements. OEMs and end-users can build their own NUC11 system based on the following components:
- Compute Element (NUC11DBBi9 or NUC11DBBi7)
- Baseboard (or backplane)
- Chassis
- PSU
- DRAM (up to 2x DDR4-3200 SODIMMs)
- Non-volatile storage
- Discrete GPU (optional)
An off-the-shelf Beast Canyon NUC11BTM kit leaves only the DRAM, non-volatile storage, and discrete GPU to the choice of the end-user. Prior to the platform analysis and overview of our review configuration, let's take a look at the pre-decided components in the above list.
Driver Bay Compute Element
The NUC11BTMi9 we are reviewing today comes with the NUC11DBBi9 NUC11 Extreme Compute Element. It comes with a soldered processor - the Core i9-11900KB. This belongs to the Tiger Lake (11th Generation) family, and has a 8C/16T configuration with a 65W TDP. It can turbo up to 5 GHz. This Compute Element is a natural successor to the NUC9 Compute Element which re-imagined the traditional motherboard in a discrete PCIe x16 card form-factor.
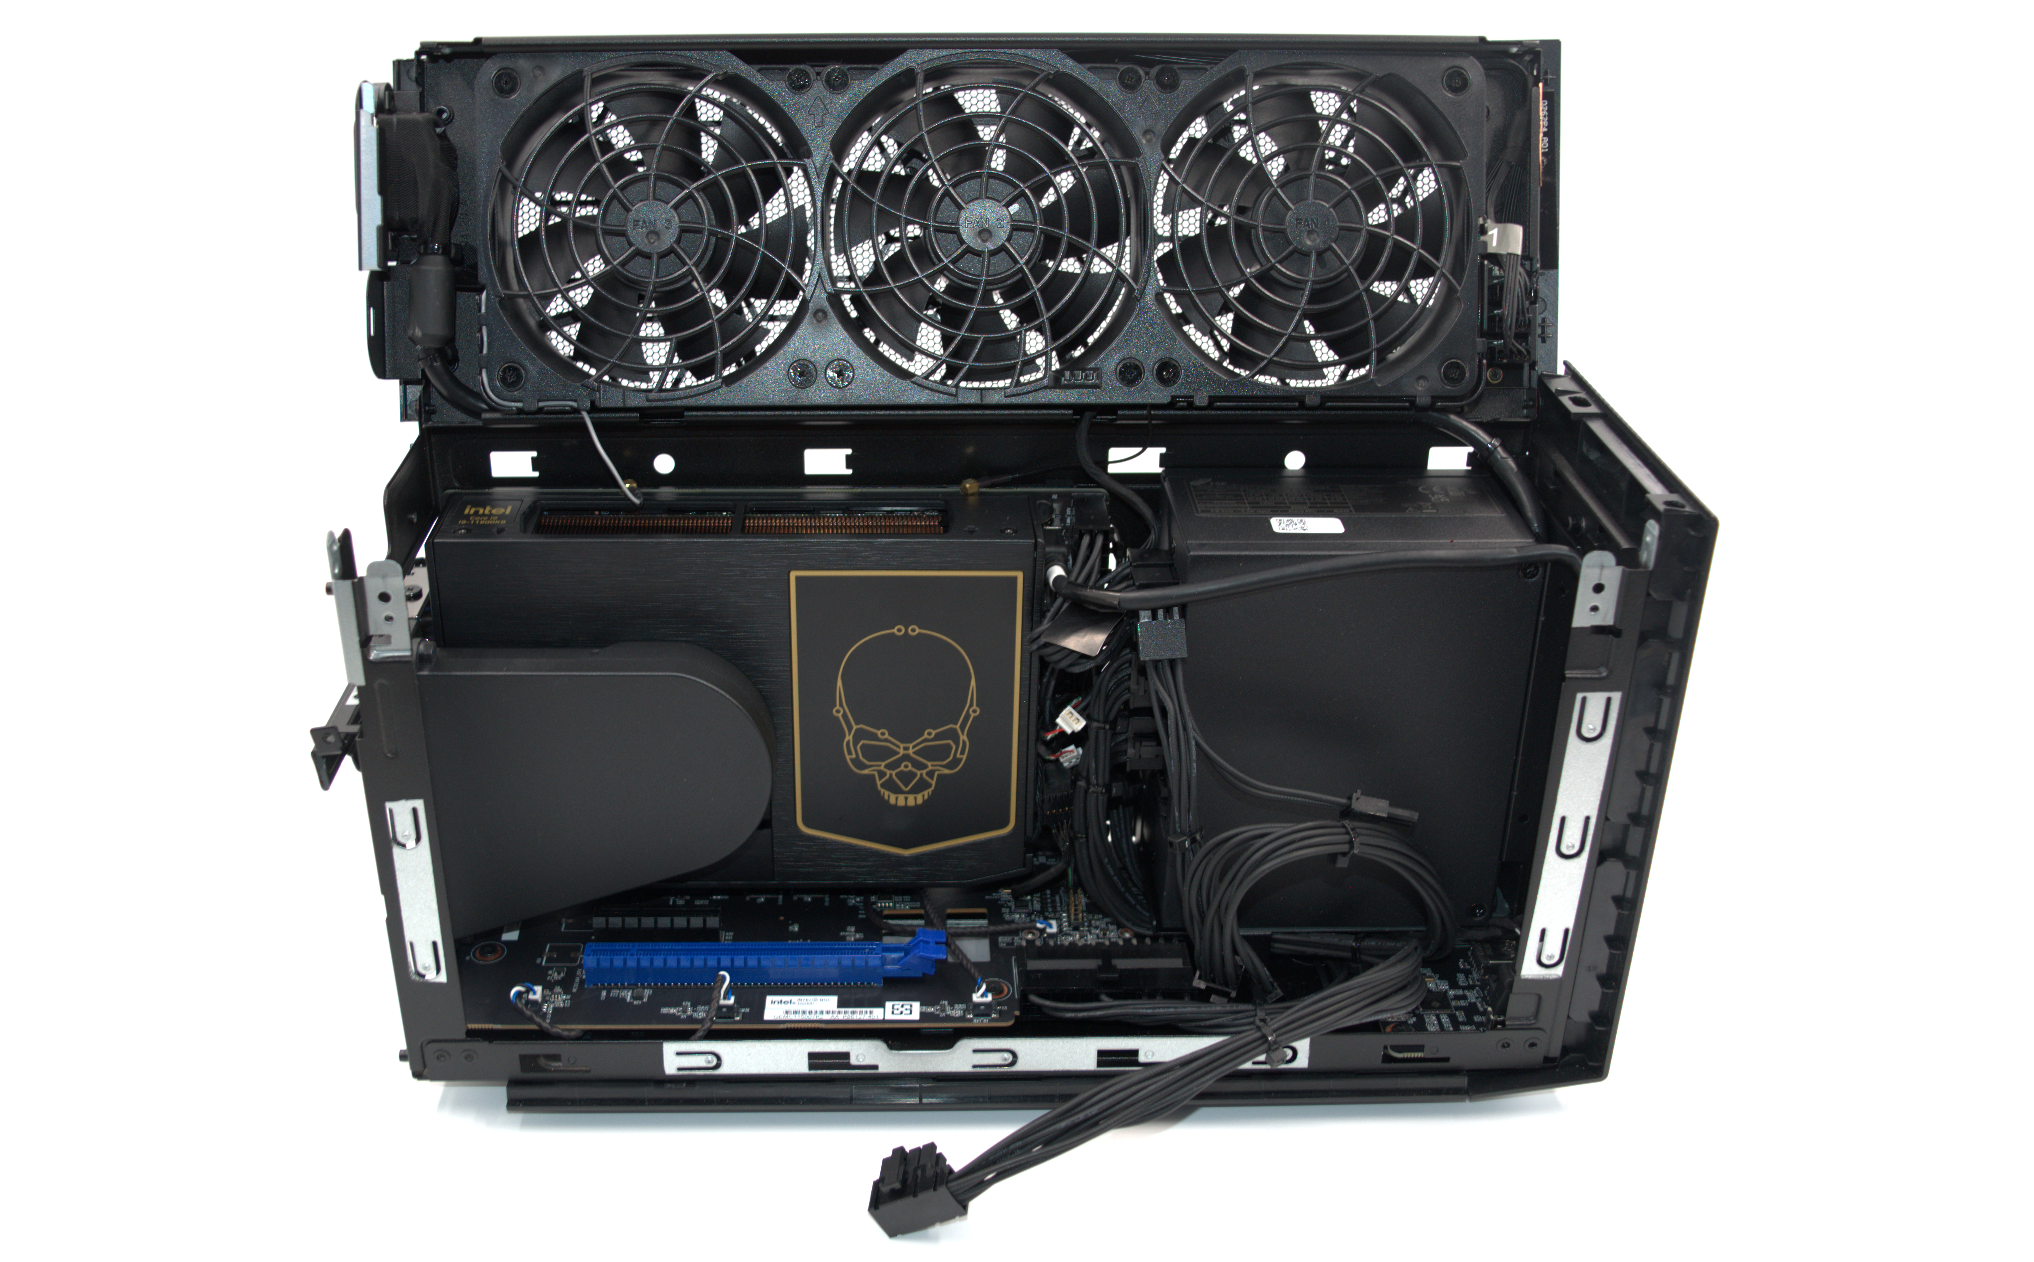
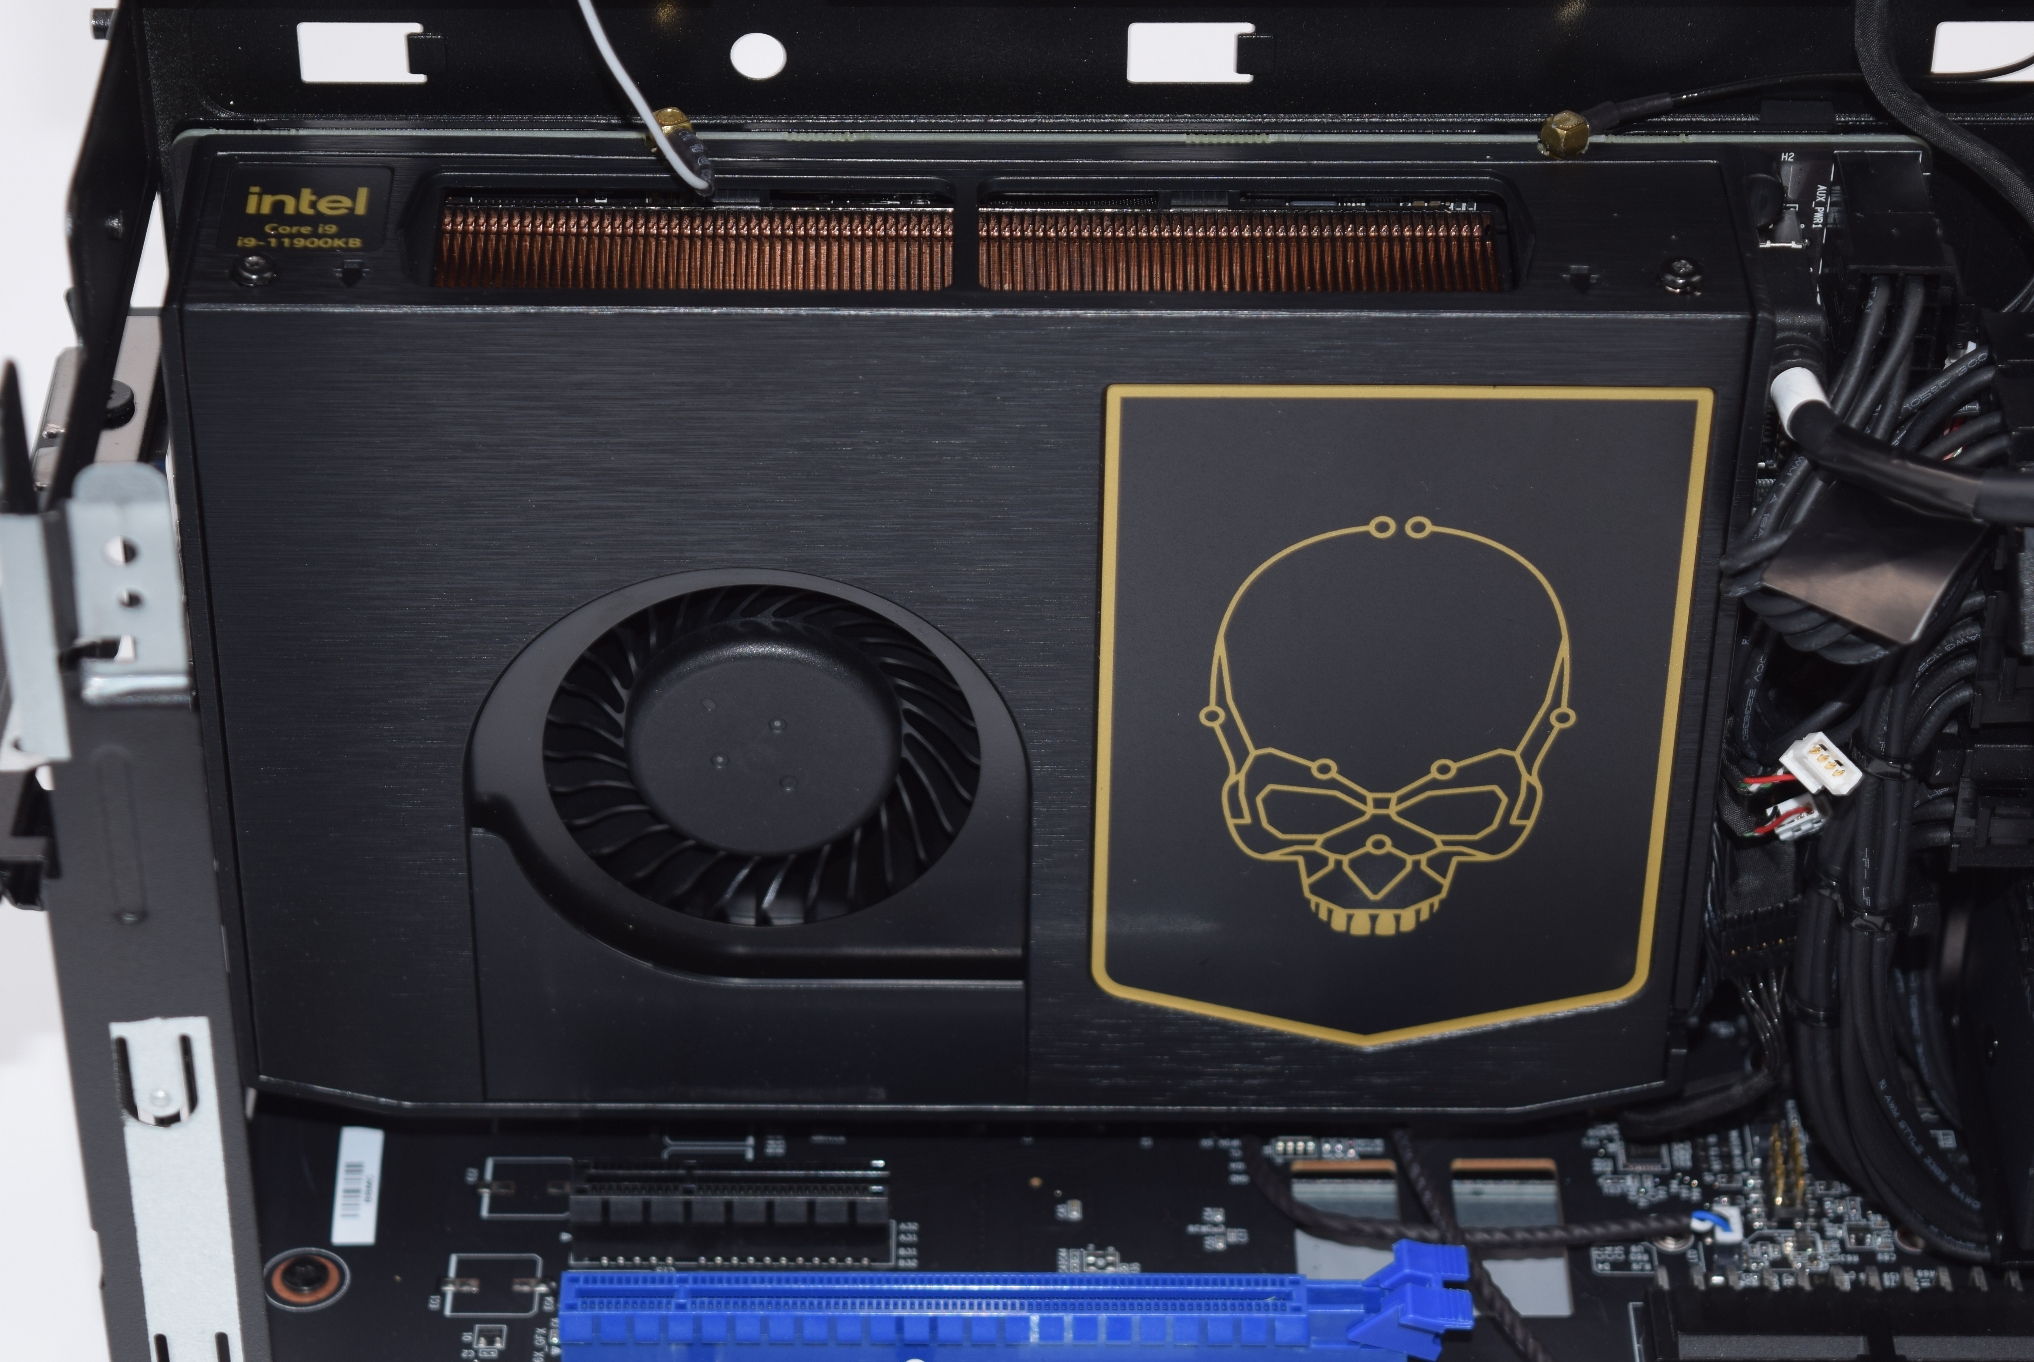
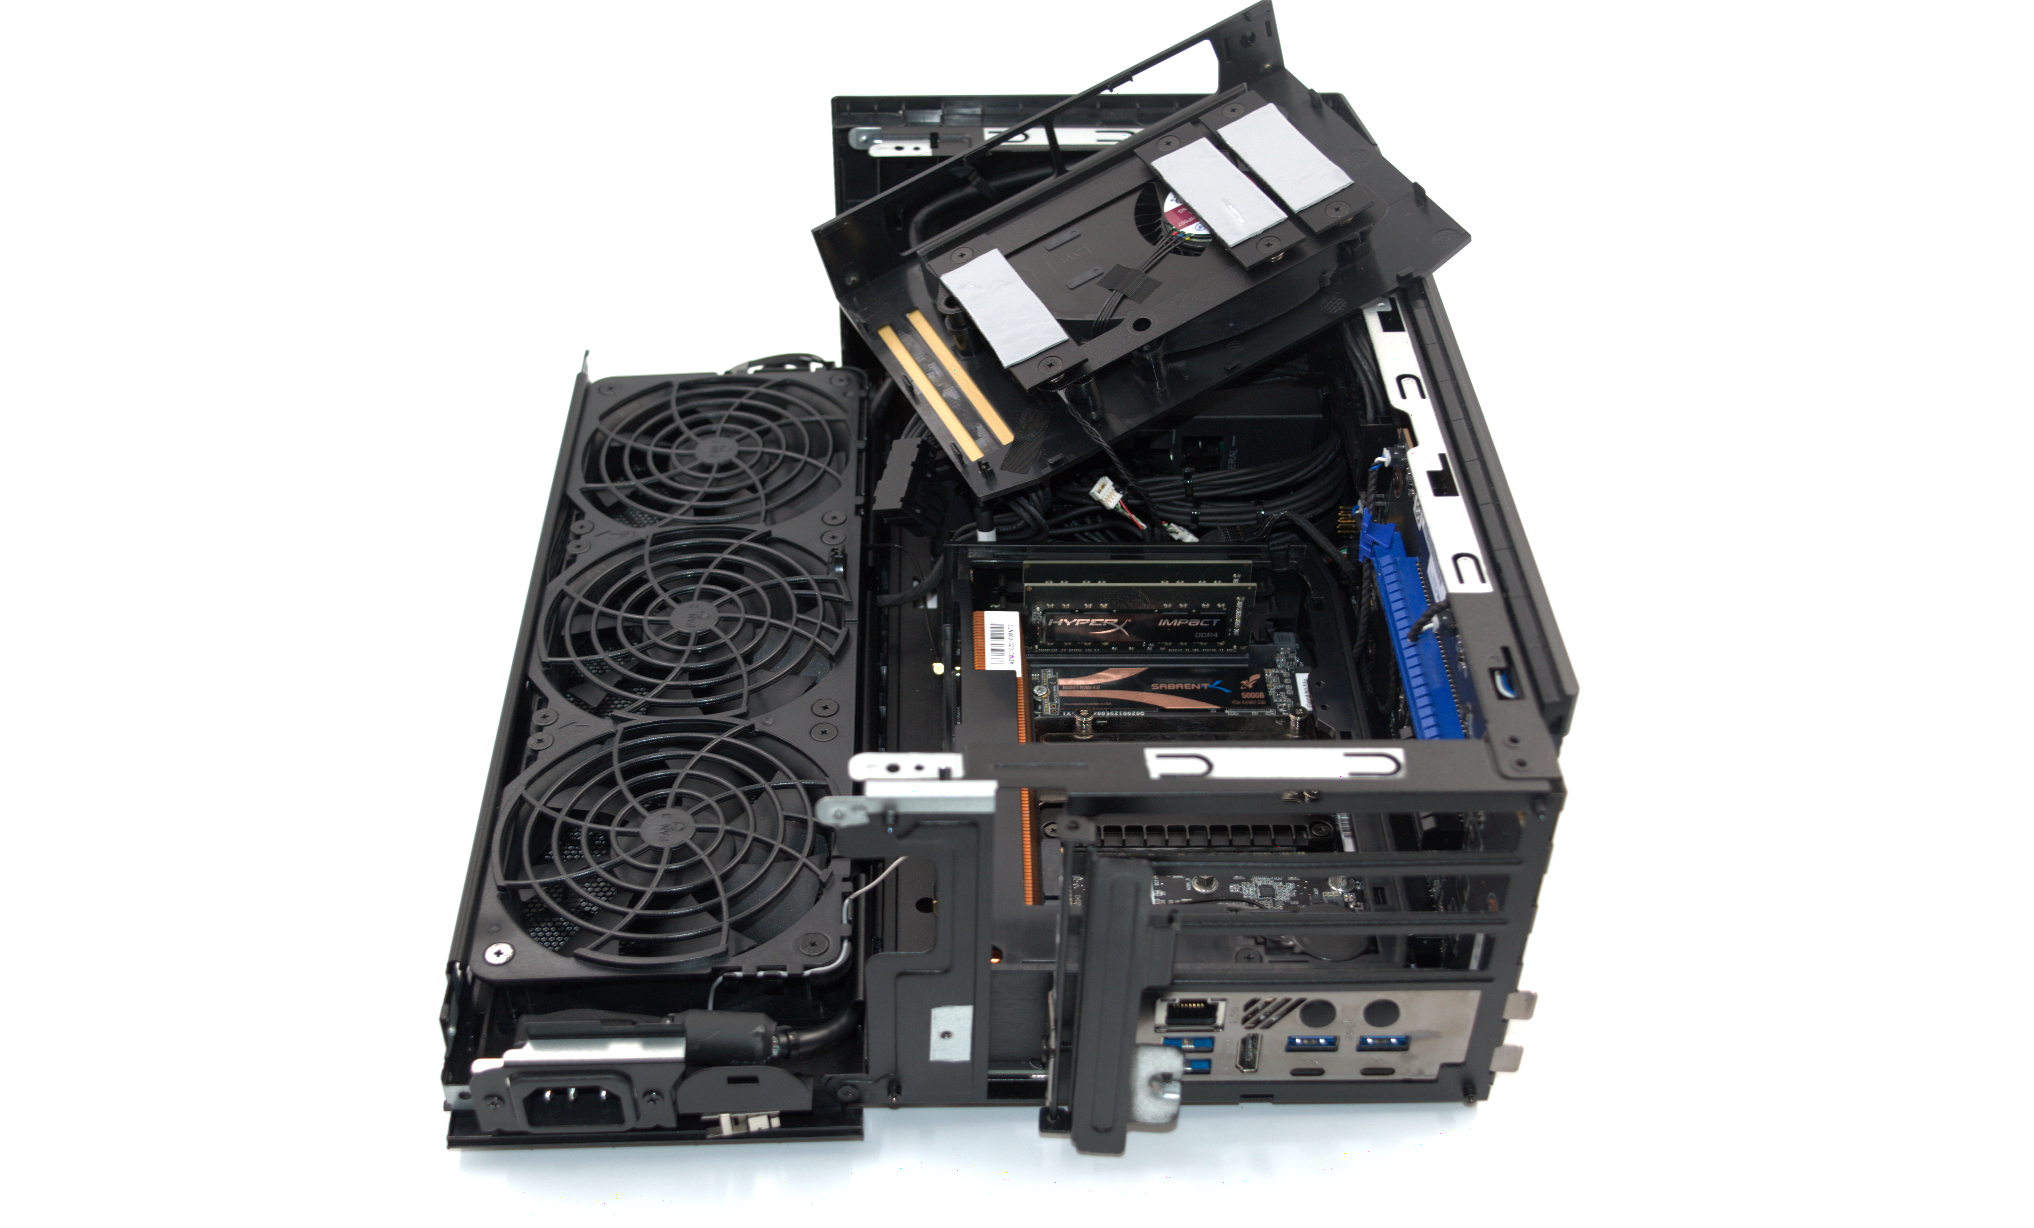
The Compute Element comes with a cooling shroud containing a single fan and three M.2 heat-sinks with thermal pads pre-attached. These align with the three M.2 2280 slots in the Compute Element. The slot to the right of the processor is enabled by the x4 Gen 4 lanes directly from the processor, while the two to the right (and the M.2 slot occupied by the WLAN card) are from the PCH. On the extreme right, we have the two SODIMM slots that can operate at speeds of up to DDR-3200 for DIMMs up to 64GB in total. These are vertical slots (compared to the horizontal ones in the NUC9 Compute Elements), and free up valuable space that gets taken up by the extra M.2 slot. The gallery below provides additional photographs of the Compute Element and the cooling shroud.


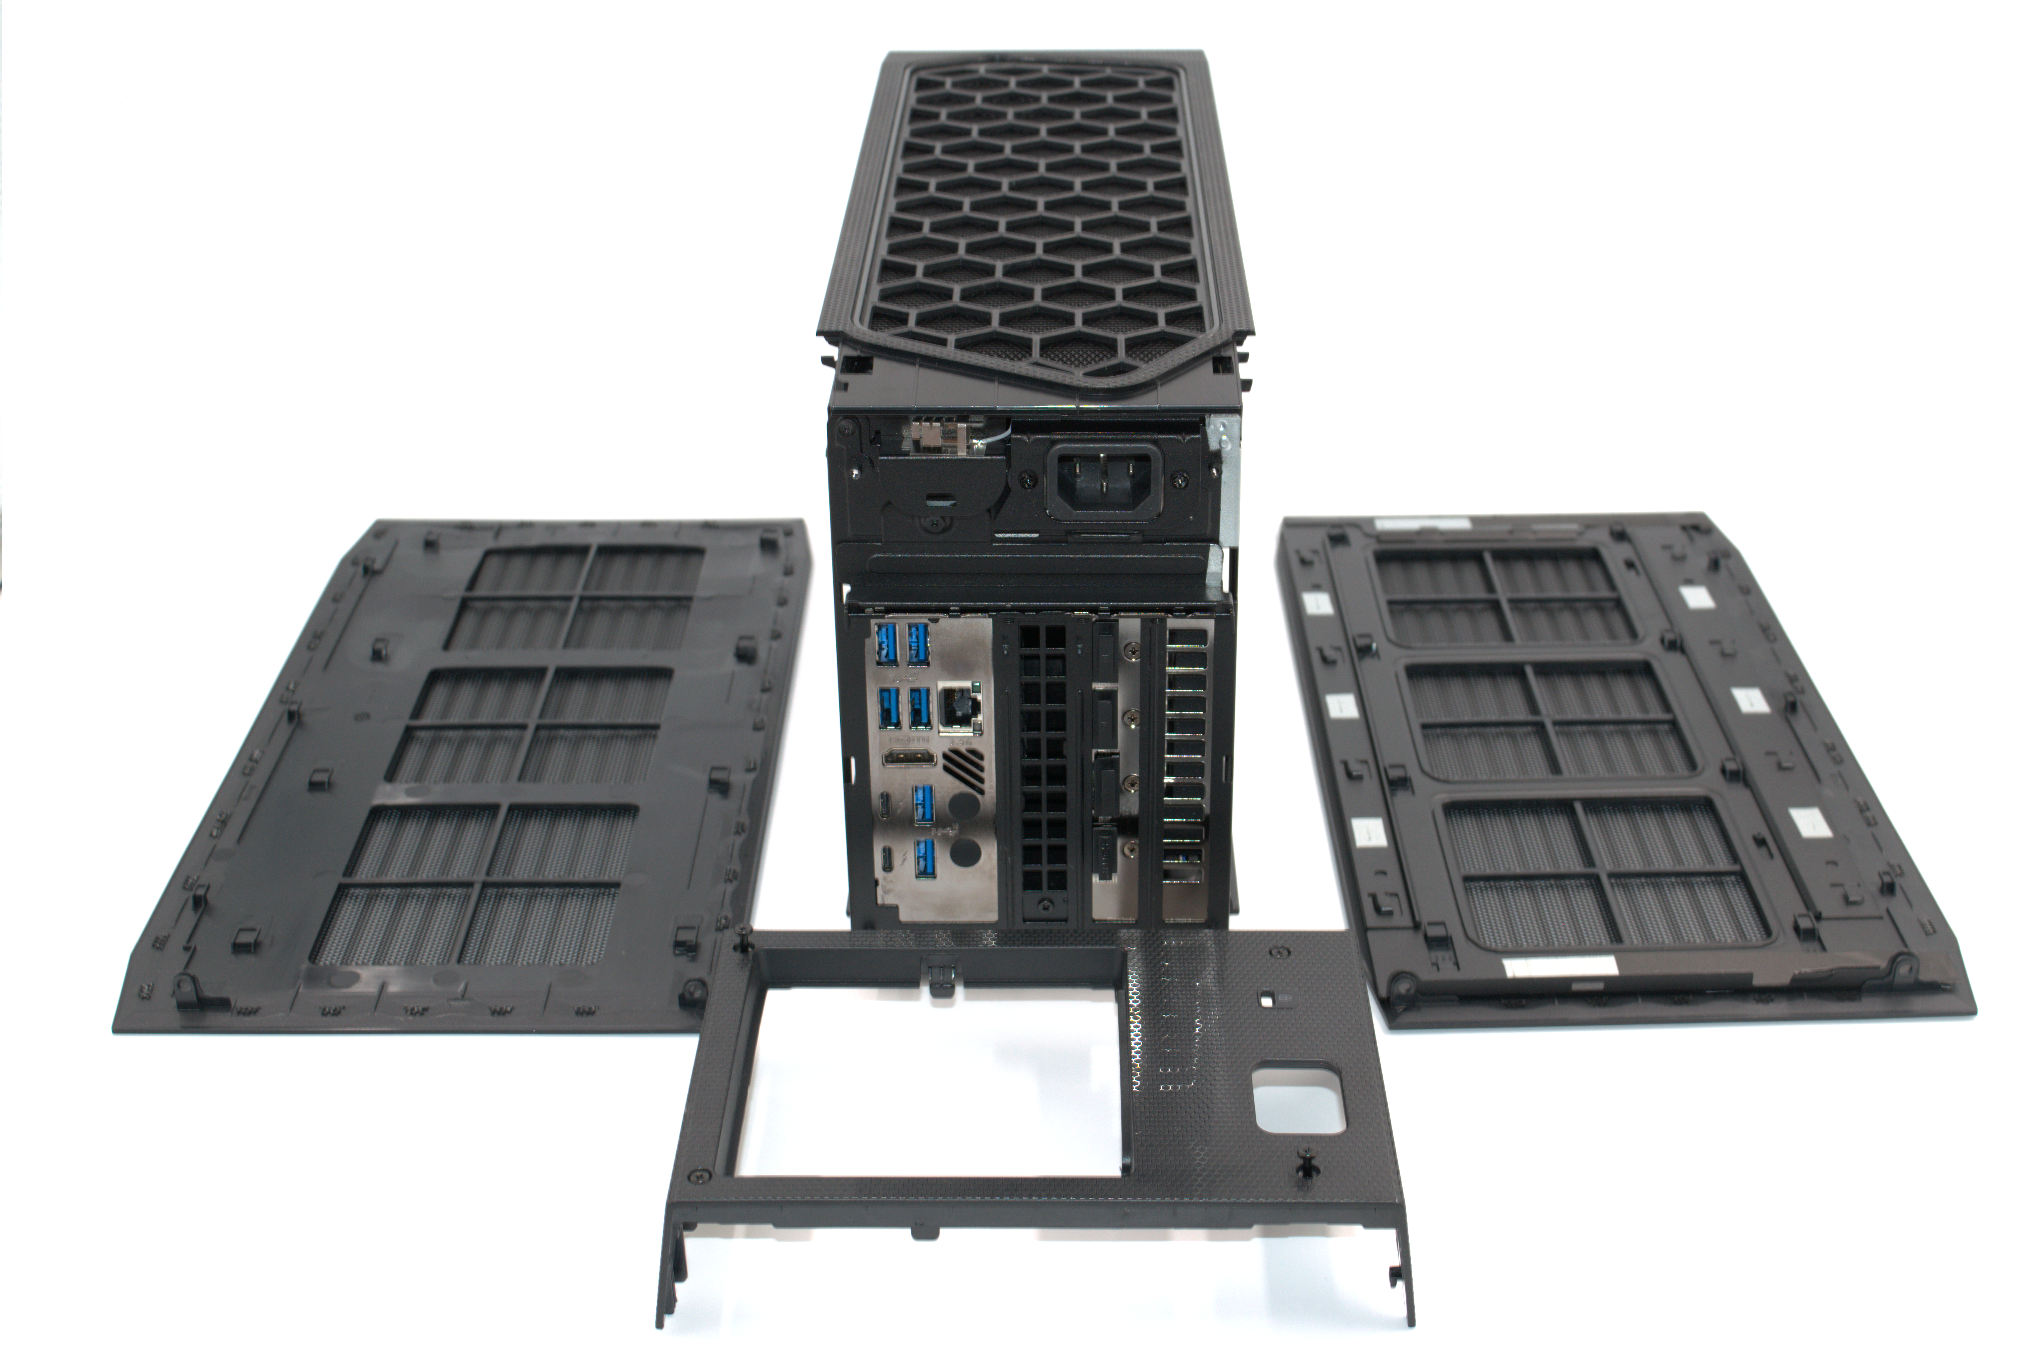
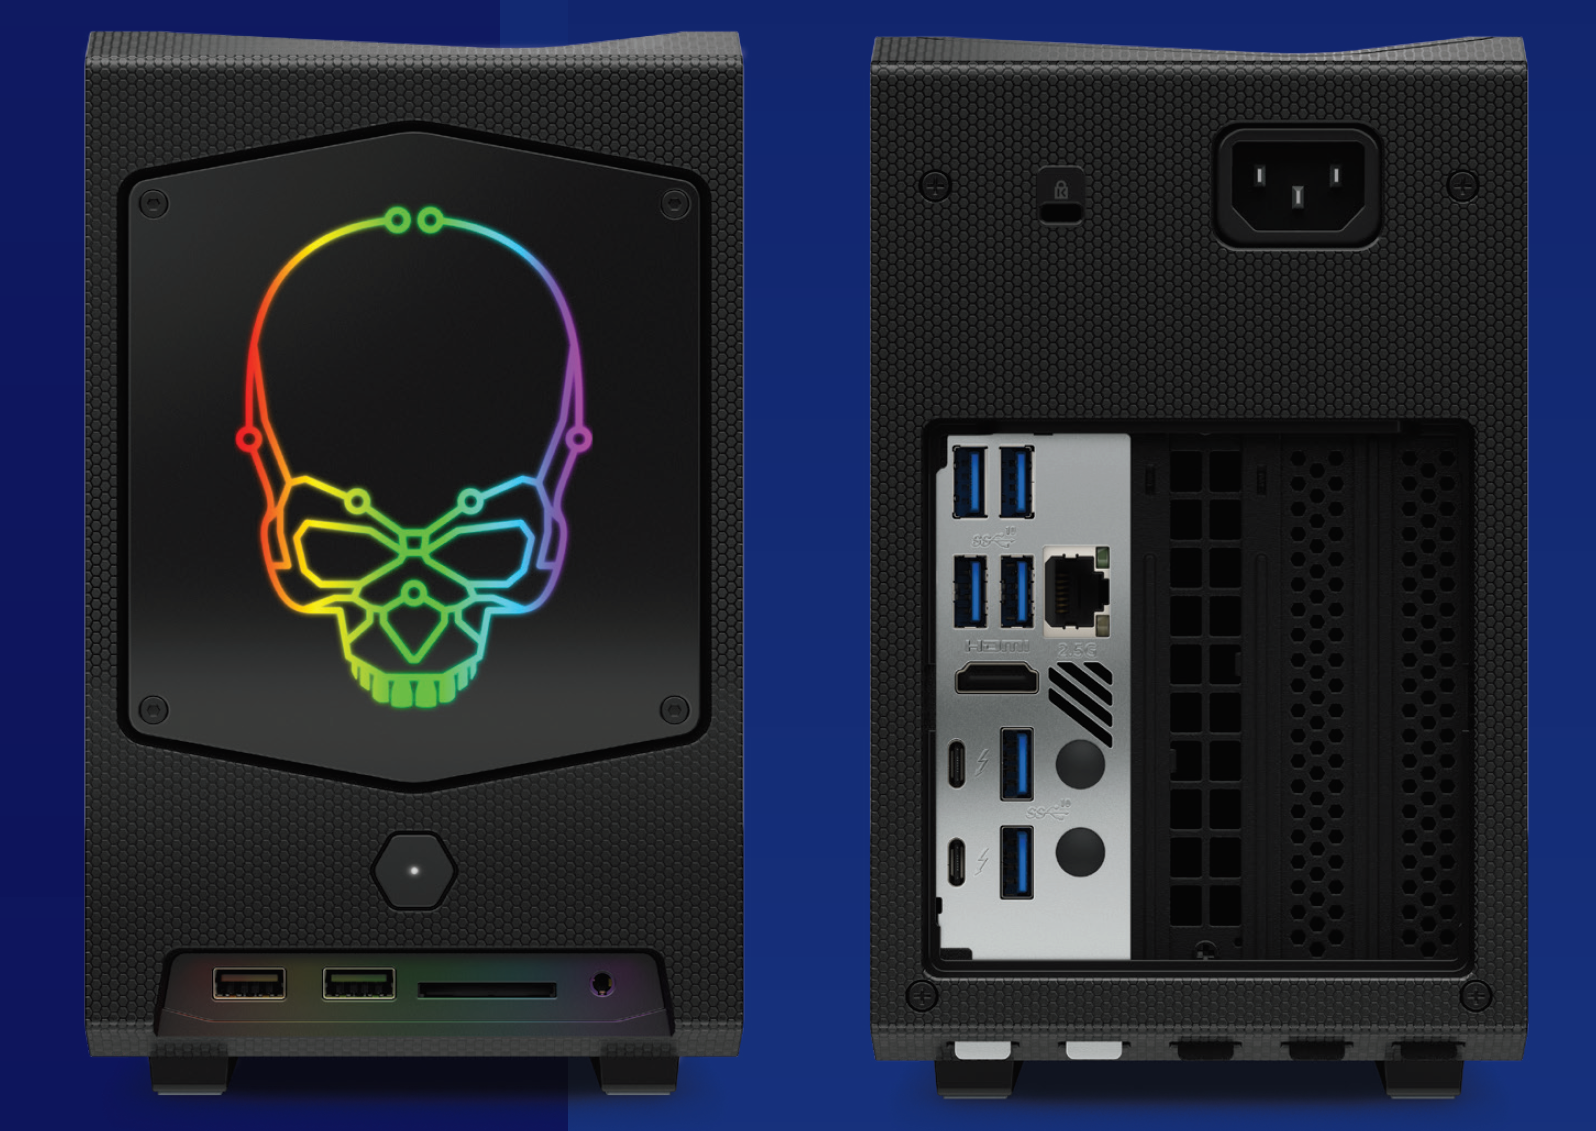
The NUC11BTMi9 comes with two Thunderbolt 4 ports, a 2.5G Ethernet port, a HDMI 2.0a display output, and six USB 3.1 Gen 2 Type-A ports in the rear. There are two USB 3.1 Gen 2 Type-A ports, a 3.5mm stereo headset jack, and a SDXC slot with UHS-II support in the front. The front I/Os are enabled by a daughterboard that connects to the headers in the Compute Element. The Compute Element has its own power connection to the PSU.
Monster Cove Baseboard
The baseboard used in the Beast Canyon (code name Monster Cove) is an evolutionary update to the West Cove board used in the Ghost Canyon. The PCIe lanes are now Gen 4, but they retain the x8 / x4 / x4 bifurcation capabilities designed into the previous generation. Thankfully, the M.2 22110 slot resulting from this bifurcation is now easily accessible from the underside of the chassis, without having to take out the Compute Element from the baseboard.
Similar to the West Cove board, the usage of either of the two x4 slots hard-limits the peripheral in the x16 slot to x8 bandwidth. This was an issue in our review configuration of the Ghost Canyon NUC, but the Beast Canyon has no such issues, as discussed further below. One of the downsides of the new baseboard compared to the West Cove is the placement of the vertical x4 PCIe slot between the Compute Element slot and the x16 slot. Due to the placement of the air guide above the Compute Element's fan (essential due to the 65W TDP of the resident CPU), the x4 slot is rendered unusable.
Chassis and PSU
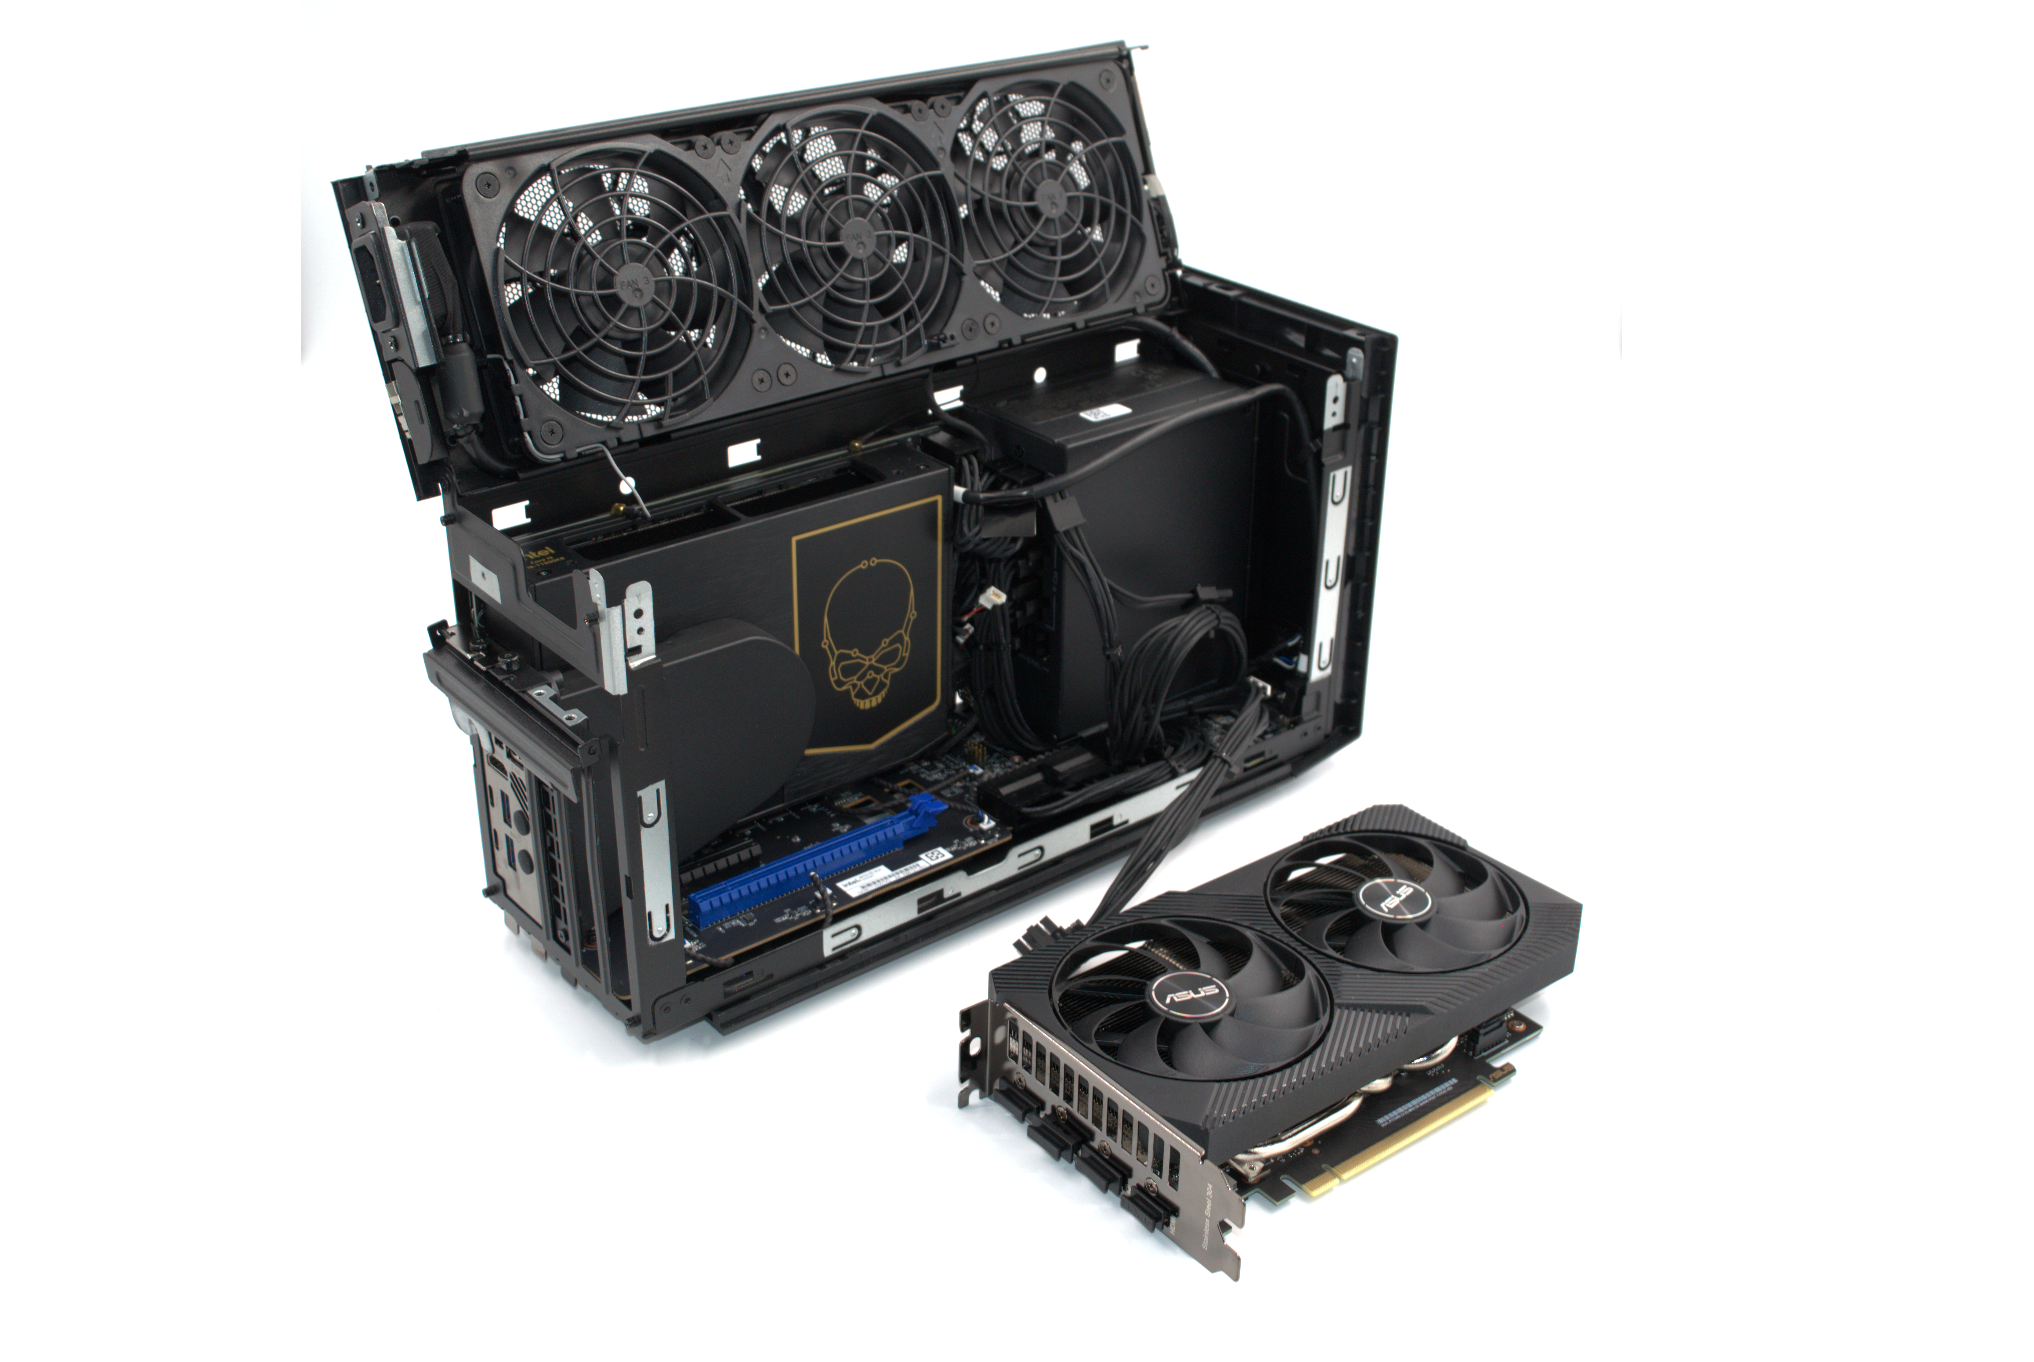
The NUC11BTMi9 chassis has the same ease of installation as the previous generation Extreme NUC. The dimensions have been expanded to allow the installation of dual slot GPUs up to 12" in length. The included 650W 80+ Gold internal PSU also supplies a 8-pin and a 2x6+2-pin connector for the GPU. The chassis can be disassembled by removing the four screws to dislodge the rear cover, and popping out the side panels.
The top panel with the three fans rests on a hinge. The embossed directions in the frame helpfully guide the user to open it up. This is essential to get access to the Compute Element and remove its shroud to install the RAM and storage.
Despite the plastic framing in the front panel, the metal-based construction in other areas gives the chassis a premium look and sturdy feel. The Beast Canyon NUC chassis also features customizable RGB underglow lighting, as well as replaceable RGB front logo. The chassis has ample space inside for easy cable management even in the presence of a discrete GPU. These are updates over the previous generation NUC Extreme.
The chassis also has a few downsides. The front USB ports are recessed, and given their Type-A nature, figuring out the correct orientation to plug in the peripherals is a bit of a hit or miss. Certain keyboard / mice receivers can end up being completely inside the recess, making it challenging to remove them when the other USB slot is also occupied. The placement of the PSU AC receptacle on the top end of the chassis means that the heavy AC power cord could potentially create cable management issues. In both these aspects, the Ghost Canyon NUC chassis had a much better design.
Our review sample of the NUC11BTMi9 came with the following components pre-installed:
- 2x Kingston HyperX KHX3200C20S4/8G for 16GB of DRAM
- 1x Sabrent Rocket NVMe 4.0 500GB M.2 2280 SSD
- ASUS Dual GeForce RTX 3060 12GB GDDR6
The presence of a desktop-class CPU in the system means that the Beast Canyon NUC should easily be able to support powerful GPUs such as the dual-slot RTX 3080 variants (even though we tested only with the RTX 3060). In the next section, we take a look at the full specifications of our review sample, followed by a detailed platform analysis along with some notes on our setup experience.
The review sample of the NUC11BTMi9 came package in a fancy plywood casing, signifying its premium nature. Since the review configuration was ready for benchmarking, the package contents only included the main unit, power cord, Windows 10 Pro installation DVD, and a USB key containing the drivers for the system. The retail packaging is bound to be quite different, as these pre-production samples are packaged to make unboxing videos attractive.
The NUC11BTMi9 sports the Intel VisualBIOS with a modern interface. It has plenty of enthusiast options to fine tune the performance. The video below presents the entire gamut of available options.
The specifications of our Intel NUC11BTMi9 review configuration are summarized in the table below.
| Intel NUC11BTMi9 (Beast Canyon) Specifications | |
| Processor | Intel Core i9-11900KB Tiger Lake-H, 8C/16T, 3.3 (4.9) (5.3) GHz 24MB L2+L3, 10nm, 65W TDP |
| Memory | Kingston HyperX KHX3200C20S4/8G DDR4 SODIMM 20-22-22-42 @ 3200 MHz 2x8 GB |
| Graphics | ASUS Dual GeForce RTX 3060 12GB GDDR6 Intel UHD Graphics for 11th Gen. |
| Disk Drive(s) | Sabrent Rocket NVMe 4.0 (500GB; M.2 Type 2280 PCIe 4.0 x4 NVMe; Kioxia 96L 3D TLC; Phison E16 Controller) |
| Networking | Intel Wi-Fi 6E AX210 (2x2 802.11ax - 2400 Mbps) 1x Intel I225-LM 2.5G Ethernet Adapter |
| Audio | 3.5mm Audio Jack (Front) Capable of 5.1/7.1 digital output with HD audio bitstreaming (HDMI) |
| Miscellaneous I/O Ports | 1x UHS-II SDXC Slot (Front) 2x USB 3.2 Gen 2 (10 Gbps) Type-A (Front) 6x USB 3.2 Gen 2 (10 Gbps) Type-A (Rear) 2x Thunderbolt 4 (40 Gbps) Type-C (Rear) |
| Operating System | Retail unit is barebones, but we installed Windows 10 Enterprise x64 |
| Pricing (As configured) | $2006 |
| Full Specifications | Intel NUC11BTMi9 Specifications |
Our review sample came with Windows 10 Pro x64 pre-installed, but, we wiped the drive and installed Windows 10 Enterprise x64 21H1 prior to benchmarking. Our initial benchmarking and reports collection was done without opening up the system. The AIDA64 system report for the hardware configuration supplied by Intel provided the following information:
- [ North Bridge: Intel Tiger Lake-H IMC ]:
- PCIe 4.0 x16 port #2 In Use @ x8 (nVIDIA GA106 - GeForce RTX 3060 12GB Video Adapter, High Definition Audio Controller)
- [ South Bridge: Intel Tiger Point WM590 ]:
- PCIe 3.0 x1 port #19 In Use @ x1 (Intel Wi-Fi 6E AX210 160MHz Wireless Network Adapter)
- PCIe 3.0 x1 port #20 In Use @ x1 (Intel I225-LM 2.5G Ethernet Network Connection)
The two Type-C ports in the Compute Element are enabled directly from the CPU. They can operate in Thunderbolt 4 (40Gbps), native USB 4 (10Gbps), and native DP1.4 modes. Each port can supply up to 15W. The rest of the I/Os are off the Tiger Point PCH. One of the key aspects here is that the DMI bottleneck has largely been alleviated with Tiger Lake. There are plenty of I/Os directly off the CPU package - including the Thunderbolt 4 ports and the CPU-attached Gen 4 NVMe storage slot. With Thunderbolt 4, it is in fact possible to completely bypass the PCH while transferring data between internal and external storage devices.
The NUC11BTMi9 is one of the few SFF systems that we have evaluated which happen to come with a discrete user-replaceable GPU. Systems with MXM GPUs are pretty much set in terms of graphics capabilities for the lifetime of the unit. In addition to the Ghost Canyon NUC from last year, we have the Zotac ZBOX MAGNUS EK71080 to compare against the Beast Canyon NUC. Zotac introduced the ZBOX MAGNUS ONE earlier this year with a Comet Lake CPU and an Ampere GPU that we still have in our review queue. So, the main focus in this piece will be on three systems - Beast Canyon, Ghost Canyon, and the ZBOX MAGNUS EK71080.
In the table below, we have an overview of the various systems that we are comparing the Intel NUC9i9QNX against. Note that they may not belong to the same market segment. The relevant configuration details of the machines are provided so that readers have an understanding of why some benchmark numbers are skewed for or against the Intel NUC11BTMi9 when we come to those sections.
| Comparative PC Configurations | ||
| Aspect | Intel NUC11BTMi9 (Beast Canyon) | |
| CPU | Intel Core i9-11900KB | Intel Core i9-11900KB |
| GPU | ASUS Dual GeForce RTX 3060 12GB GDDR6 Intel UHD Graphics for 11th Gen |
ASUS Dual GeForce RTX 3060 12GB GDDR6 Intel UHD Graphics for 11th Gen |
| RAM | Kingston HyperX KHX3200C20S4/8G DDR4-3200 SODIMM 20-22-22-42 @ 3200 MHz 2x8 GB |
Kingston HyperX KHX3200C20S4/8G DDR4-3200 SODIMM 20-22-22-42 @ 3200 MHz 2x8 GB |
| Storage | Sabrent Rocket NVMe 4.0 (500 GB; M.2 Type 2280 PCIe 4.0 x4 NVMe; Kioxia 96L 3D TLC) (Phison E16 Controller) |
Sabrent Rocket NVMe 4.0 (500 GB; M.2 Type 2280 PCIe 4.0 x4 NVMe; Kioxia 96L 3D TLC) (Phison E16 Controller) |
| Wi-Fi | Intel Wi-Fi 6E AX210 | Intel Wi-Fi 6E AX210 |
| Price (in USD, when built) | $1350 (barebones) $2006 (as configured / No OS) |
$1350 (barebones) $2006 (as configured / No OS) |
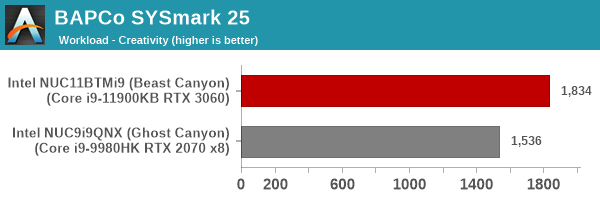
The Intel NUC11BTMi9 (Beast Canyon) was evaluated using our Fall 2018 test suite for small-form factor PCs. In the first section, we will be looking at SYSmark 25.
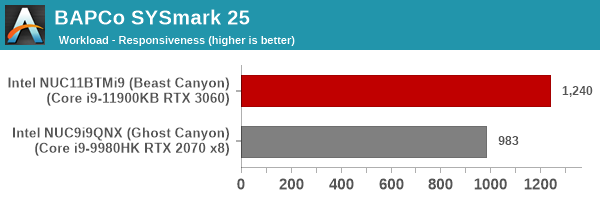
BAPCo's SYSmark 25 is an application-based benchmark that uses real-world applications to replay usage patterns of business users in the areas of productivity, creativity, and responsiveness. The 'Productivity Scenario' covers office-centric activities including word processing, spreadsheet usage, financial analysis, software development, application installation, file compression, and e-mail management. The 'Creativity Scenario' represents media-centric activities such as digital photo processing, AI and ML for face recognition in photos and videos for the purpose of content creation, etc. The 'Responsiveness Scenario' evaluates the ability of the system to react in a quick manner to user inputs in areas such as application and file launches, web browsing, and multi-tasking.
Scores are meant to be compared against a reference desktop (the SYSmark 25 calibration system, a Lenovo Thinkcenter M720q with a Core i5-8500T and 8GB of DDR4 memory to go with a 256GB M.2 NVMe SSD). The calibration system scores 1000 in each of the scenarios. A score of, say, 2000, would imply that the system under test is twice as fast as the reference system.


SYSmark 25 also adds energy measurement to the mix. A high score in the SYSmark benchmarks might be nice to have, but, potential customers also need to determine the balance between power consumption and the efficiency of the system. For example, in the average office scenario, it might not be worth purchasing a noisy and power-hungry PC just because it ends up with a 2000 score in the SYSmark 2014 SE benchmarks. In order to provide a balanced perspective, SYSmark 25 also allows vendors and decision makers to track the energy consumption during each workload. In the graphs below, we find the total energy consumed by the PC under test for a single iteration of each SYSmark 25 workload. For reference, the calibration system consumes 8.88 Wh for productivity, 10.81 Wh for creativity, and 19.69 Wh overall.
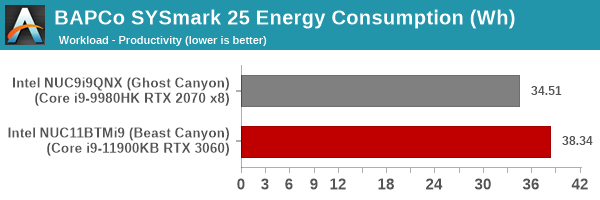
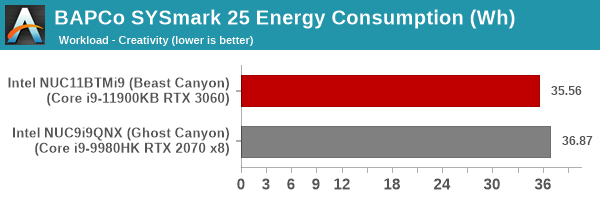
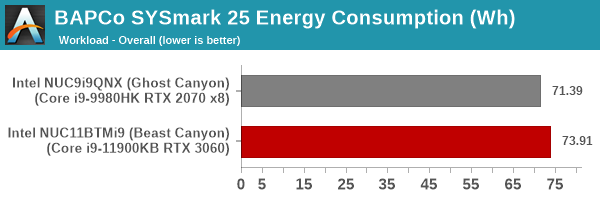
The Beast Canyon outscores the Ghost Canyon by around 20%. The increase in energy consumption is miniscule.
This section deals with a couple of UL Futuremark benchmarks - PCMark 10 and 3DMark. While PCMark evaluates the system as a whole, 3DMark focuses on the graphics capabilities with emphasis on gaming workloads.
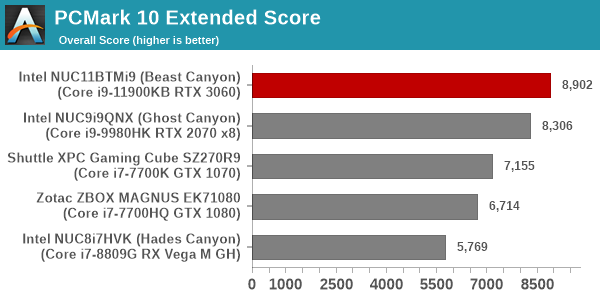
PCMark 10
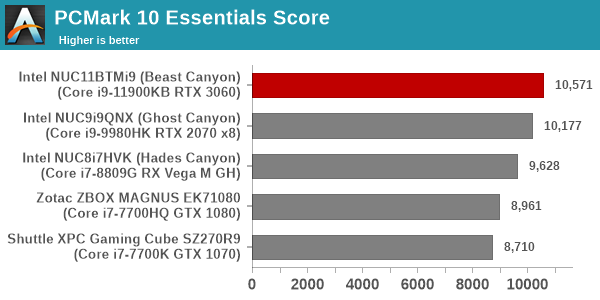
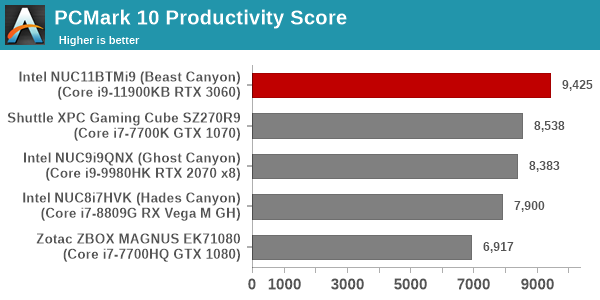
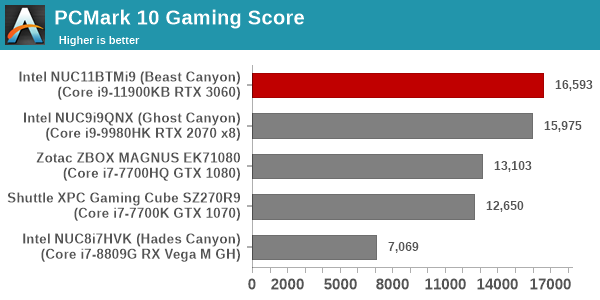
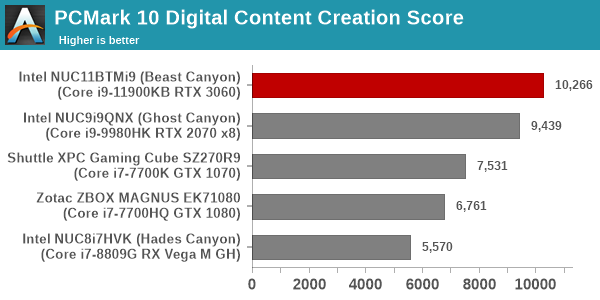
UL's PCMark 10 evaluates computing systems for various usage scenarios (generic / essential tasks such as web browsing and starting up applications, productivity tasks such as editing spreadsheets and documents, gaming, and digital content creation). We benchmarked select PCs with the PCMark 10 Extended profile and recorded the scores for various scenarios. These scores are heavily influenced by the CPU and GPU in the system, though the RAM and storage device also play a part. The power plan was set to Balanced for all the PCs while processing the PCMark 10 benchmark.
3DMark
UL's 3DMark comes with a diverse set of graphics workloads that target different Direct3D feature levels. Correspondingly, the rendering resolutions are also different. We use 3DMark 2.4.4264 to get an idea of the graphics capabilities of the system. In this section, we take a look at the performance of the Intel NUC11BTMi9 (Beast Canyon) across the different 3DMark workloads.
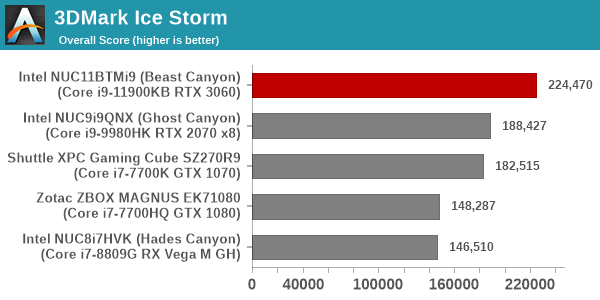
3DMark Ice Storm
This workload has three levels of varying complexity - the vanilla Ice Storm, Ice Storm Unlimited, and Ice Storm Extreme. It is a cross-platform benchmark (which means that the scores can be compared across different tablets and smartphones as well). All three use DirectX 11 (feature level 9) / OpenGL ES 2.0. While the Extreme renders at 1920 x 1080, the other two render at 1280 x 720. The graphs below present the various Ice Storm worloads' numbers for different systems that we have evaluated.
| UL 3DMark - Ice Storm Workloads | |||
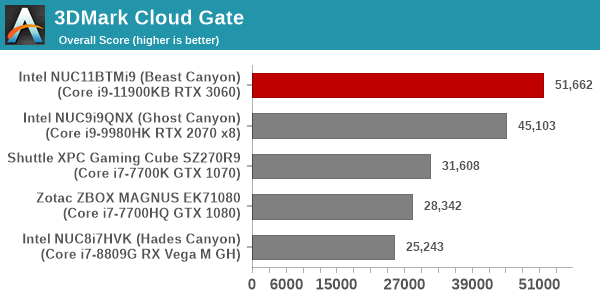
3DMark Cloud Gate
The Cloud Gate workload is meant for notebooks and typical home PCs, and uses DirectX 11 (feature level 10) to render frames at 1280 x 720. The graph below presents the overall score for the workload across all the systems that are being compared.
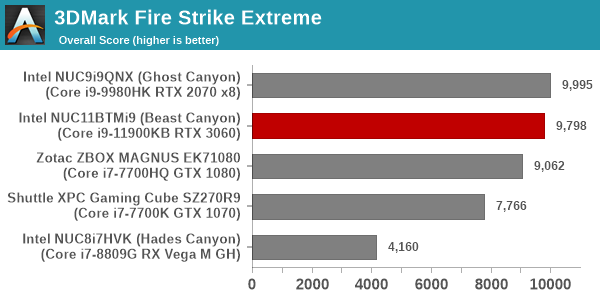
3DMark Fire Strike
The Fire Strike benchmark has three workloads. The base version is meant for high-performance gaming PCs. Similar to Sky Diver, it uses DirectX 11 (feature level 11) to render frames at 1920 x 1080. The Extreme version targets 1440p gaming requirements, while the Ultra version targets 4K gaming system, and renders at 3840 x 2160. The graph below presents the overall score for the Fire Strike Extreme and Fire Strike Ultra benchmark across all the systems that are being compared.
| UL 3DMark - Fire Strike Workloads | |||
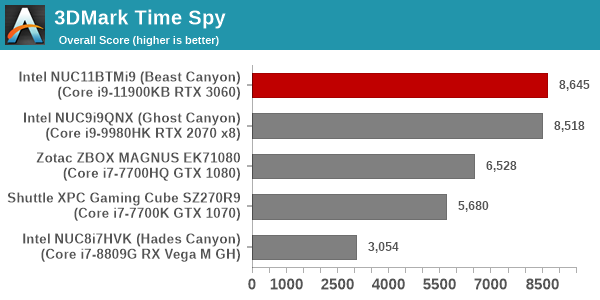
3DMark Time Spy
The Time Spy workload has two levels with different complexities. Both use DirectX 12 (feature level 11). However, the plain version targets high-performance gaming PCs with a 2560 x 1440 render resolution, while the Extreme version renders at 3840 x 2160 resolution. The graphs below present both numbers for all the systems that are being compared in this review.
| UL 3DMark - Time Spy Workloads | |||
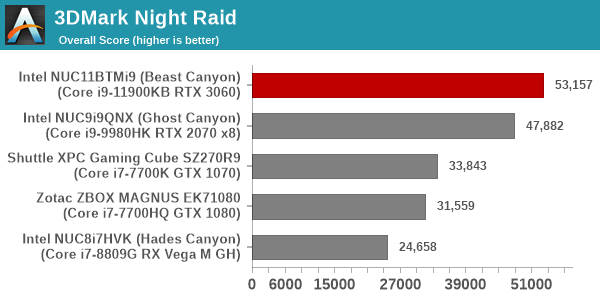
3DMark Night Raid
The Night Raid workload is a DirectX 12 benchmark test. It is less demanding than Time Spy, and is optimized for integrated graphics. The graph below presents the overall score in this workload for different system configurations.
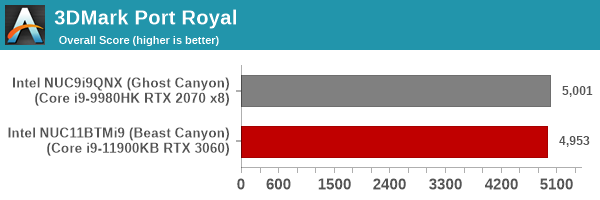
3DMark Port Royal
UL introduced the Port Royal ray-tracing benchmark as a DLC for 3DMark in early 2019. The scores serve as an indicator of how the system handles ray-tracing effects in real-time.
3DMark CPU Profile Benchmark
UL recently introduced a benchmark to test the multi-threaded capabilities of the CPU in a system. Since gaming workloads are often multi-threaded, it makes sense to include this testing as part of the 3DMark suite. The benchmark routine attempts to perform the simulation of birds / bird-like objects flocking together using as many advanced capabilities as offered by the processor. The workload is configured to run with different number of threads ranging from 1 to 16 (and a single entry for the maximum number of threads allowed in the system).
| UL 3DMark - CPU Profile Benchmark | |||
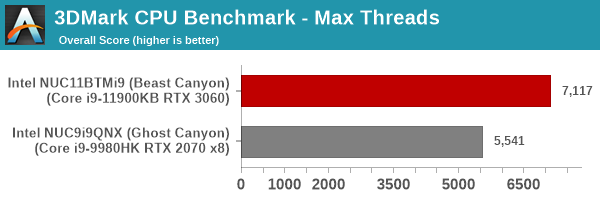
We present the benchmark results for the single and maximum threads case above.
In almost all workloads, the Beast Canyon outscores other systems heavily. In the case of GPU-bound workloads, the tussle between the RTX 2070 in the Ghost Canyon and the RTX 3060 in the Beast Canyon is too close to call.
This section looks at some of the other commonly used benchmarks representative of the performance of specific real-world applications.
Web Browser Benchmarks - JetStream and Speedometer
Web browser-based workloads have emerged as a major component of the typical home and business PC usage scenarios. Beginning with this review, we are including browser-focused benchmarks from the WebKit developers. Hosted at BrowserBench, JetStream 2.0 benchmarks JavaScript and WebAssembly performance, while Speedometer measures web application responsiveness. We also process MotionMark, but the confidence level of the results vary as much as +/-35%. Hence, we present graphs only the Jetstream 2.0 and Speedometer results for the three top browsers below.
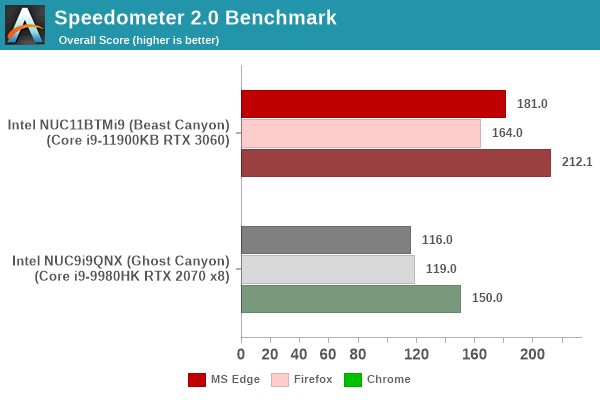
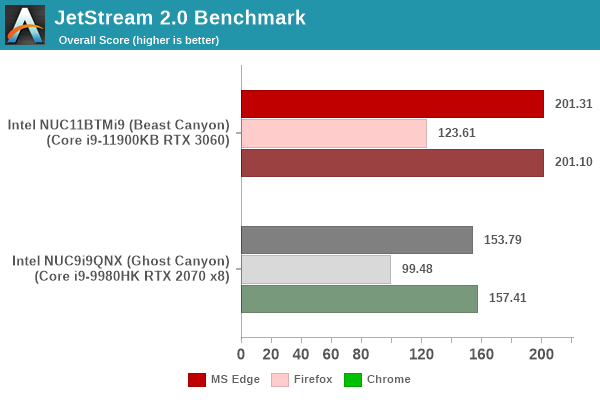
In order to maintain reproducibility, we self-host the BrowserBench benchmarks (git clone of the WebKit repository as on July 1, 2021). The browser versions used for the numbers above are presented in the table included in each system's review.
| Intel NUC11BTMi9 Browser Bench | |||
| Speedometer 2.0 | JetStream 2.0 | MotionMark 1.2 | |
| Microsoft Edge (92.0.902.55) |
181 ± 2.2 | 201.313 | 900.46 ± 14.16% |
| Google Chrome (92.0.4515.107) |
212.1 ± 2.1 | 201.097 | 1115.74 ± 5.54% |
| Mozilla Firefox (90.0.2.7872) |
164 ± 2.2 | 123.612 | 1072.12 ± 3.44% |
BAPCo's SYSmark 25 and UL's PCMark benchmarks both include web browser activities as part of their evaluation scheme. However, the performance for this increasingly important workload tends to get lost in the presentation of a single number. JetStream and Speedometer help us focus on how different PC configurations vary in terms of the user experience with respect to web browsers.
3D Rendering - CINEBENCH R23
We use CINEBENCH R23 for 3D rendering evaluation. R23 provides two benchmark modes - single threaded and multi-threaded. Evaluation of different PC configurations in both supported modes provided us the following results.
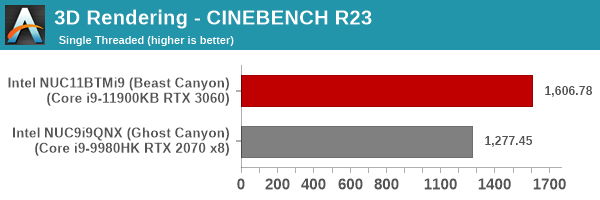
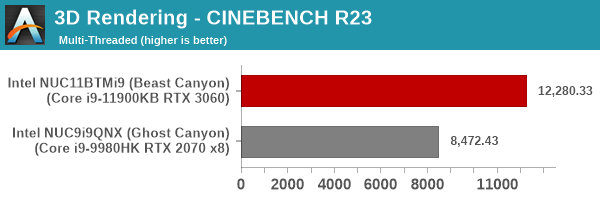
The microarchitectural improvements in Tiger Lake help the Beast Canyon outscore the Ghost Canyon by a significant margin.
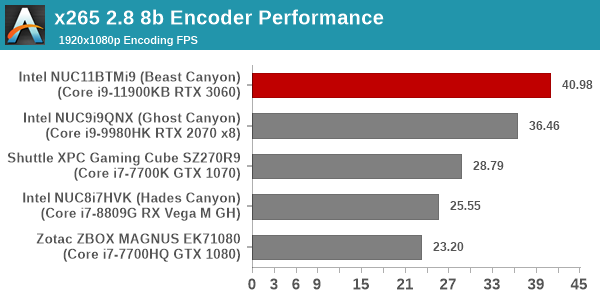
x265 Benchmark
Next up, we have some video encoding benchmarks using x265 v2.8. The appropriate encoder executable is chosen based on the supported CPU features. In the first case, we encode 600 1080p YUV 4:2:0 frames into a 1080p30 HEVC Main-profile compatible video stream at 1 Mbps and record the average number of frames encoded per second.
Our second test case is 1200 4K YUV 4:2:0 frames getting encoded into a 4Kp60 HEVC Main10-profile video stream at 35 Mbps. The encoding FPS is recorded.
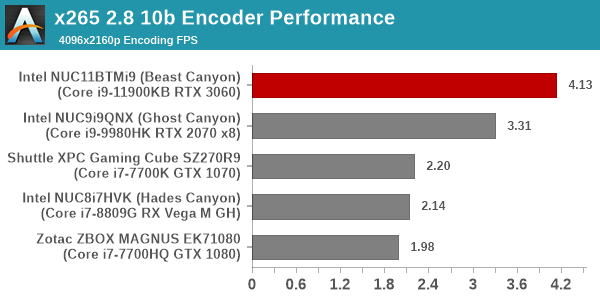
The latest Tiger Lake microarchitecture again helps the Beast Canyon come out on top.
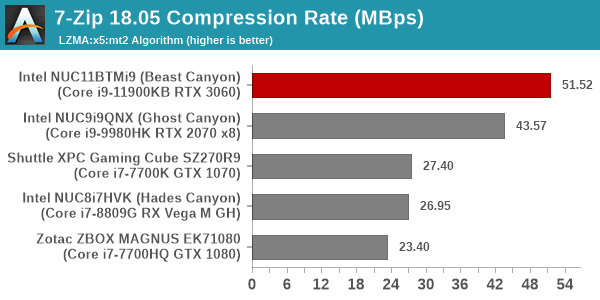
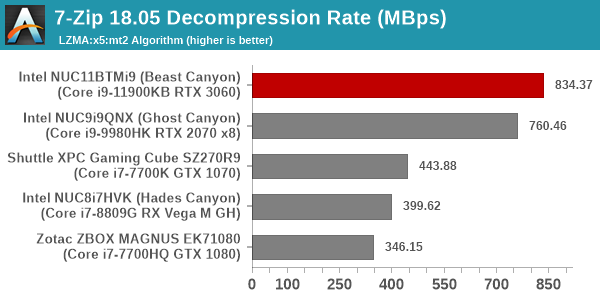
7-Zip
7-Zip is a very effective and efficient compression program, often beating out OpenCL accelerated commercial programs in benchmarks even while using just the CPU power. 7-Zip has a benchmarking program that provides tons of details regarding the underlying CPU's efficiency. In this subsection, we are interested in the compression and decompression rates when utilizing all the available threads for the LZMA algorithm.
Cryptography Benchmarks
Cryptography has become an indispensable part of our interaction with computing systems. Almost all modern systems have some sort of hardware-acceleration for making cryptographic operations faster and more power efficient. In this sub-section, we look at two different real-world applications that may make use of this acceleration.
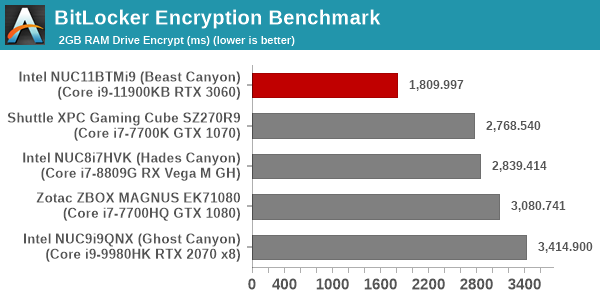
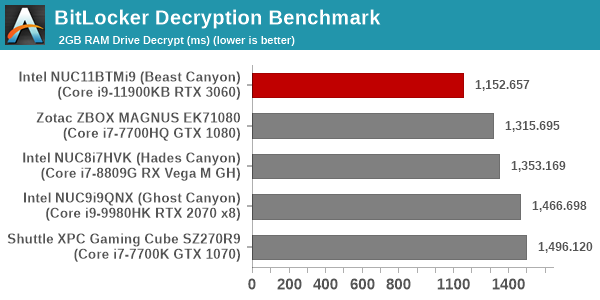
BitLocker is a Windows features that encrypts entire disk volumes. While drives that offer encryption capabilities are dealt with using that feature, most legacy systems and external drives have to use the host system implementation. Windows has no direct benchmark for BitLocker. However, we cooked up a BitLocker operation sequence to determine the adeptness of the system at handling BitLocker operations. We start off with a 2.5GB RAM drive in which a 2GB VHD (virtual hard disk) is created. This VHD is then mounted, and BitLocker is enabled on the volume. Once the BitLocker encryption process gets done, BitLocker is disabled. This triggers a decryption process. The times taken to complete the encryption and decryption are recorded. This process is repeated 25 times, and the average of the last 20 iterations is graphed below.
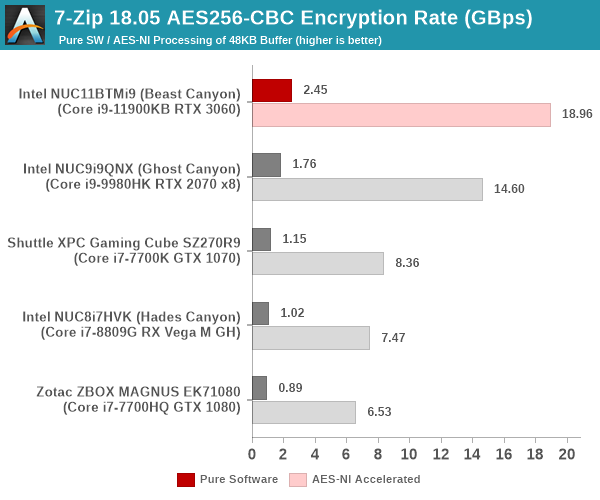
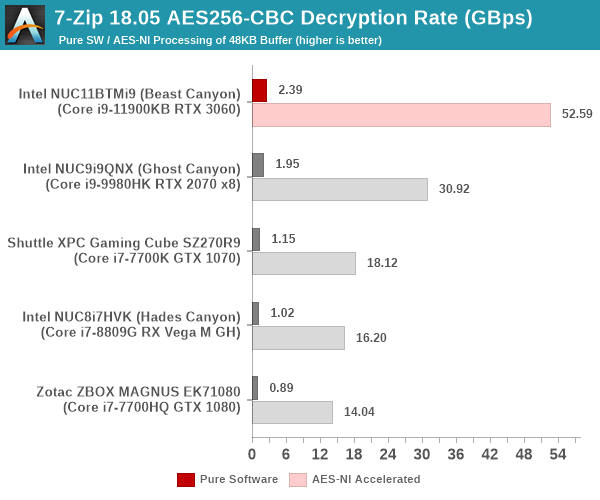
Creation of secure archives is best done through the use of AES-256 as the encryption method while password protecting ZIP files. We re-use the benchmark mode of 7-Zip to determine the AES256-CBC encryption and decryption rates using pure software as well as AES-NI. Note that the 7-Zip benchmark uses a 48KB buffer for this purpose.
Yet another cryptography application is secure network communication. OpenSSL can take advantage of the acceleration provided by the host system to make operations faster. It also has a benchmark mode that can use varying buffer sizes. We recorded the processing rate for a 8KB buffer using the hardware-accelerated AES256-CBC-HAC-SHA1 feature.
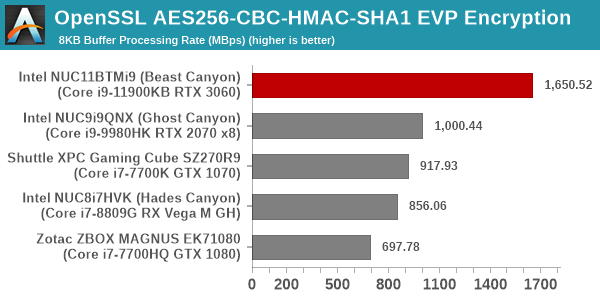

In every cryptography application, the Tiger Lake-based Beast Canyon is the runaway leader.
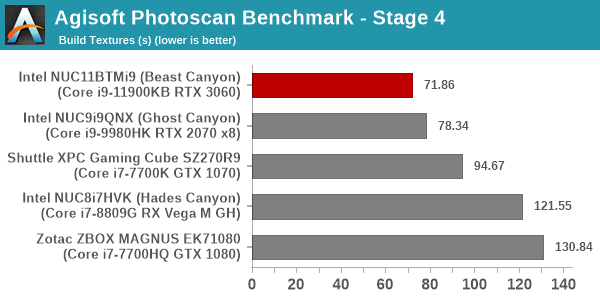
Agisoft Photoscan
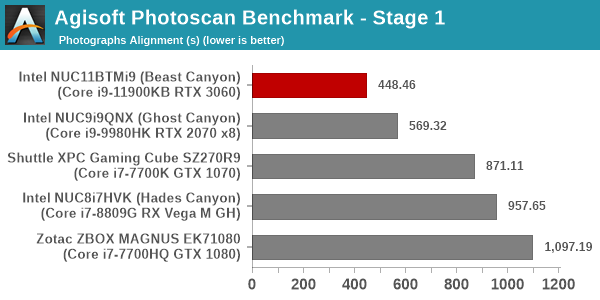
Agisoft PhotoScan is a commercial program that converts 2D images into 3D point maps, meshes and textures. The program designers sent us a command line version in order to evaluate the efficiency of various systems that go under our review scanner. The command line version has two benchmark modes, one using the CPU and the other using both the CPU and GPU (via OpenCL). We present the results from our evaluation using the CPU mode only. The benchmark (v1.3) takes 84 photographs and does four stages of computation:
- Stage 1: Align Photographs (capable of OpenCL acceleration)
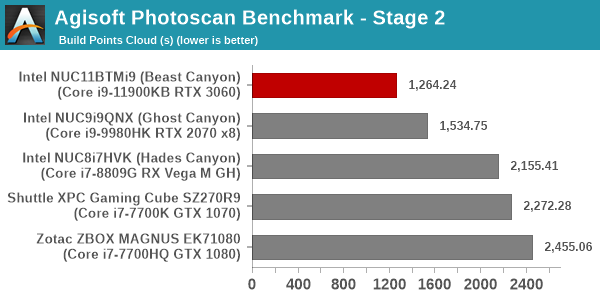
- Stage 2: Build Point Cloud (capable of OpenCL acceleration)
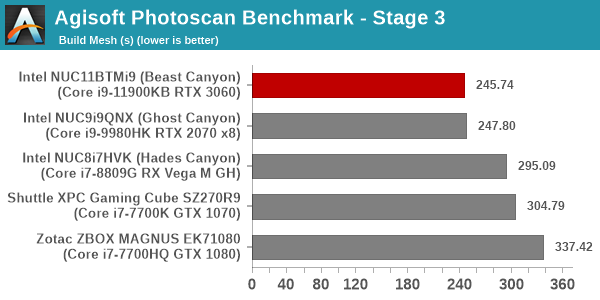
- Stage 3: Build Mesh
- Stage 4: Build Textures
We record the time taken for each stage. Since various elements of the software are single threaded, and others multithreaded, it is interesting to record the effects of CPU generations, speeds, number of cores, and DRAM parameters using this software.
Dolphin Emulator
Wrapping up our application benchmark numbers is the new Dolphin Emulator (v5) benchmark mode results. This is again a test of the CPU capabilities.
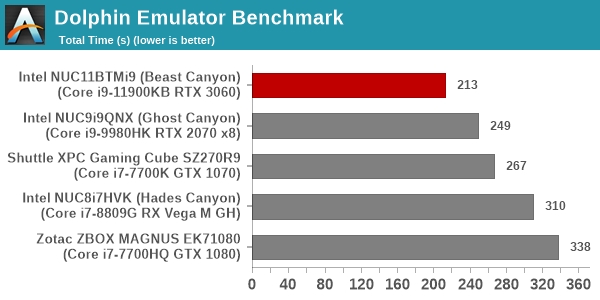
Overall, the CPU capabilities of the Core i9-11900KB with its new Tiger Lake microarchitecture / increased L2+L3 cache help the Beast Canyon NUC handily outwit the other contenders across all the workloads analyzed in this section.
The Beast Canyon NUC's gaming prowess was evaluated using our 2018 gaming test suite (to ensure we have a good set of comparison points from our previous reviews):
- Civlization VI (DX12)
- Dota 2
- F1 2017
- Grand Theft Auto V
- Middle Earth: Shadow of War
- Far Cry 5
Most system reviews take a handful of games and process them at one resolution / quality settings for comparison purposes. Recently, we have seen many pre-built systems coming out with varying gaming capabilities. Hence, it has become imperative to give consumers an idea of how a given system performs over a range of resolutions and quality settings for each game. With our latest suite, we are able to address this aspect.
Civilization VI (DX12)
The Civilization series of turn-based strategy games is very popular. For such games, the frame rate is not necessarily an important factor in the gaming experience. However, with Civilization VI, Firaxis has cranked up the visual fidelity to make the game more attractive. As a result, the game can be taxing on the GPU as well as the CPU, particularly in the DirectX 12 mode.
| Civilization VI (DirectX 12) Performance | |||

We processed the built-in benchmark at two different resolutions (1080p and 2160p), and with two different quality settings (medium and ultra, with the exact differences detailed here). All settings and resolutions point to the Beast Canyon being the runaway winner. It is the CPU capabilities that probably edge the scores here, given that the RTX 3060 and RTX 2070 perform quite similar to each other in most of the other workloads.
Dota 2
Dota 2 has been featuring in our mini-PC and notebook reviews for a few years now, but, it still continues to be a very relevant game. Our evaluation was limited to a custom replay file at 1080p resolution with enthusiast settings ('best-looking' preset). We have now revamped our testing to include multiple resolutions - This brings out the fact that the game is CPU-limited in many configurations.
Dota 2 allows for multiple renderers - we use the DirectX 11 mode. The rendering settings are set to 'enthusiast level' (best-looking, which has all options turned on, and at Ultra level, except for the Shadow Quality set to 'High'). We cycle through different resolutions after setting the monitor resolution to match the desired resolution. The core scripts and replay files are sourced from Jonathan Liebig's original Dota 2 benchmarking instructions which used a sequence of frames from Match 3061101068.
| Dota 2 - Enthusiast Quality Performance | |||
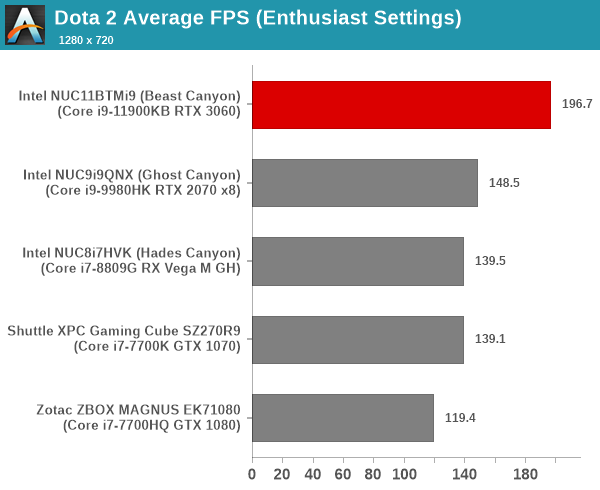
Dota 2 is not a taxing benchmark for these high-end systems, and the Beast Canyon is either comfortably on top, or within the margin of error when things are too close to call.
F1 2017
Our gaming system reviews have always had a representative racing game in it. While our previous benchmark suite for PCs featured Dirt 2, we have moved on to the more recent F1 2017 from Codemasters for our revamp.
| F1 2017 - Ultra Quality Performance | |||
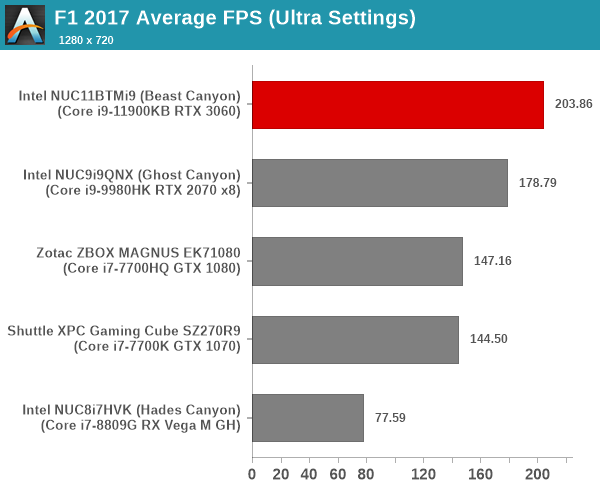
The supplied example benchmark (with some minor tweaks) is processed at four different resolutions while maintaining the graphics settings at the built-in 'Ultra' level. The trend observed in previous games holds true here also, with the Beast Canyon emerging on top.
Grand Theft Auto V
GTA doesn’t provide graphical presets, but opens up the options to users and extends the boundaries by pushing even the hardest systems to the limit using Rockstar’s Advanced Game Engine under DirectX 11. Whether the user is flying high in the mountains with long draw distances or dealing with assorted trash in the city, when cranked up to maximum it creates stunning visuals but hard work for both the CPU and the GPU. For our test we have scripted a version of the in-game benchmark. The in-game benchmark consists of five scenarios: four short panning shots with varying lighting and weather effects, and a fifth action sequence that lasts around 90 seconds. We use only the final part of the benchmark, which combines a flight scene in a jet followed by an inner city drive-by through several intersections followed by ramming a tanker that explodes, causing other cars to explode as well. This is a mix of distance rendering followed by a detailed near-rendering action sequence.
| Grand Theft Auto V Performance | |||
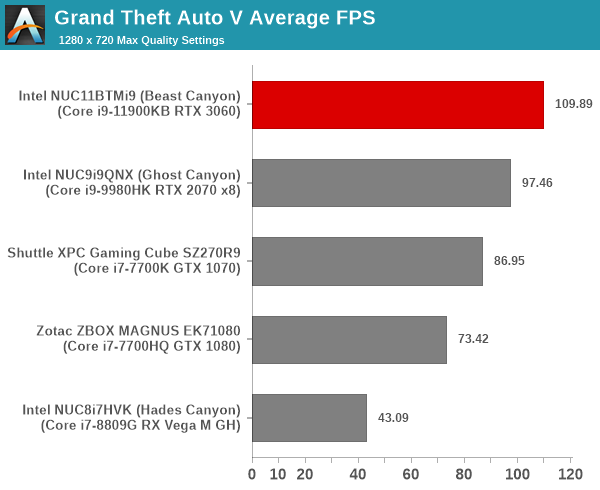
We processed the benchmark across various resolutions and quality settings (detailed here). The results are presented above.Except for the 4KMax setting where the Ghost Canyon takes the lead, it is the Beast Canyon outperforming all other systems here.
Middle Earth: Shadow of War
Middle Earth: Shadow of War is an action RPG. In our previous gaming benchmarks suite, we used its prequel - Shadow of Mordor. Produced by Monolith and using the new LithTech Firebird engine and numerous detail add-ons, Shadow of War goes for detail and complexity. The graphics settings include standard options such as Graphical Quality, Lighting, Mesh, Motion Blur, Shadow Quality, Textures, Vegetation Range, Depth of Field, Transparency and Tessellation. There are standard presets as well. The game also includes a 'Dynamic Resolution' option that automatically alters graphics quality to hit a pre-set frame rate. We benchmarked the game at four different resolutions - 4K, 1440p, 1080p, and 720p. Two standard presets - Ultra and Medium - were used at each resolution after turning off the dynamic resolution option.
| Middle Earth: Shadow of War Performance | |||

The Ghost Canyon NUC and the Beast Canyon NUC perform very similarly at higher resolutions in this benchmark. Both outperform the other systems handily across the board, though.
Far Cry 5
Ubisoft's Far Cry 5 is an action-adventure first-person shooter game released in March 2018. The game comes with an in-built benchmark and has standard pre-sets for quality settings. We benchmarked the game at four different resolutions - 720p, 1080p, 1440p, and 2160p. Two preset quality settings were processed at each resolution - normal and ultra.
| Far Cry 5 Performance | |||

Similar to the other games, the RTX 3060 combined with the Tiger Lake-H CPU help the Beast Canyon come out on top across all resolutions and quality settings.
Overall, the Tiger Lake-H CPU's capabilities complement the prowess of the GeForce RTX 3060 nicely to provide a gameplay experience better than previous generation systems. As we shall see later on, this is at a lower price point while maintaining similar power consumption levels.
The power consumption at the wall was measured with a 4K display being driven through the HDMI port of the discrete GPU. In the graphs below, we compare the idle and load power of the Intel NUC11BTMi9 (Beast Canyon) with other similar PCs evaluated before. For load power consumption, we ran the AIDA64 System Stability Test with various stress components, as well as the artificial power virus test involving Prime95 and Furmark. The maximum sustained power consumption at the wall was recorded.
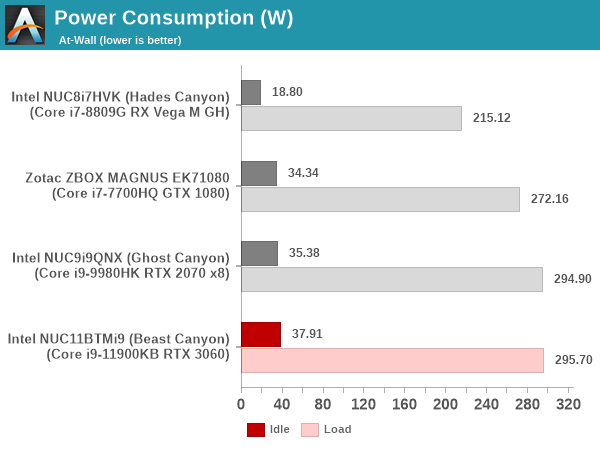
The numbers are very similar to the ones obtained for the Ghost Canyon NUC.
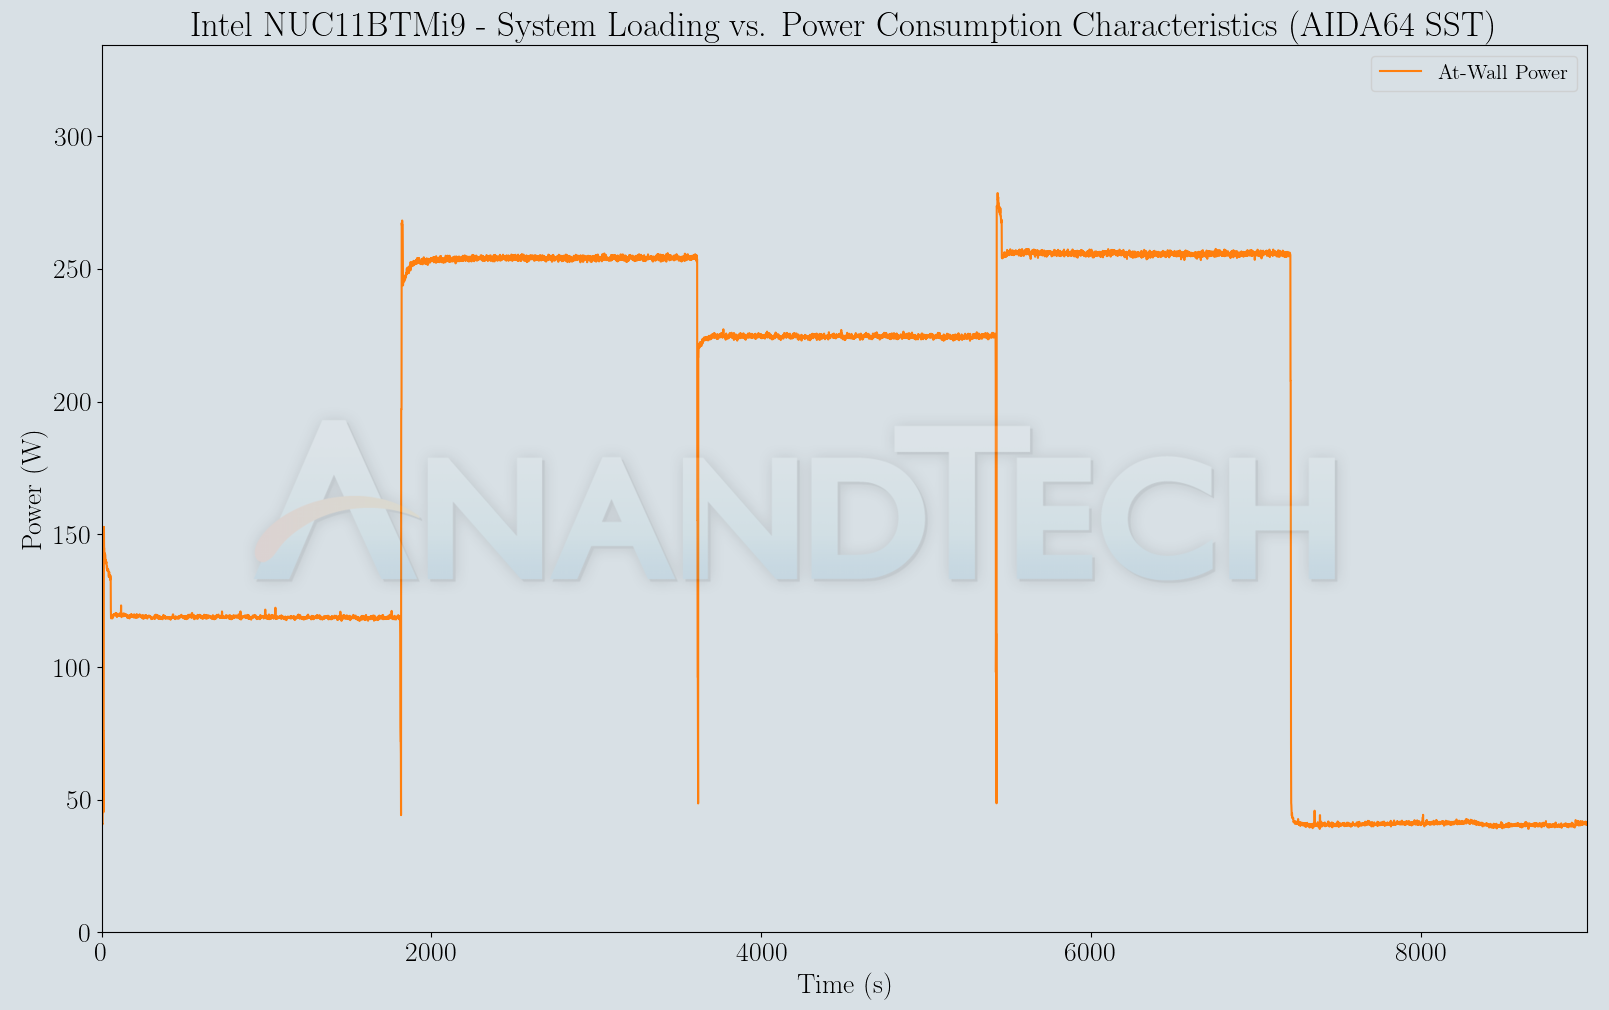
Our thermal stress routine starts with the system at idle, followed by four stages of different system loading profiles using the AIDA64 System Stability Test (each of 30 minutes duration). In the first stage, we stress the CPU, caches and RAM. In the second stage, we add the GPU to the above list. In the third stage, we stress the GPU standalone. In the final stage, we stress all the system components (including the disks). Beyond this, we leave the unit idle in order to determine how quickly the various temperatures in the system can come back to normal idling range. The various temperatures and power consumption number for the system during the above routine are presented in the graphs below.
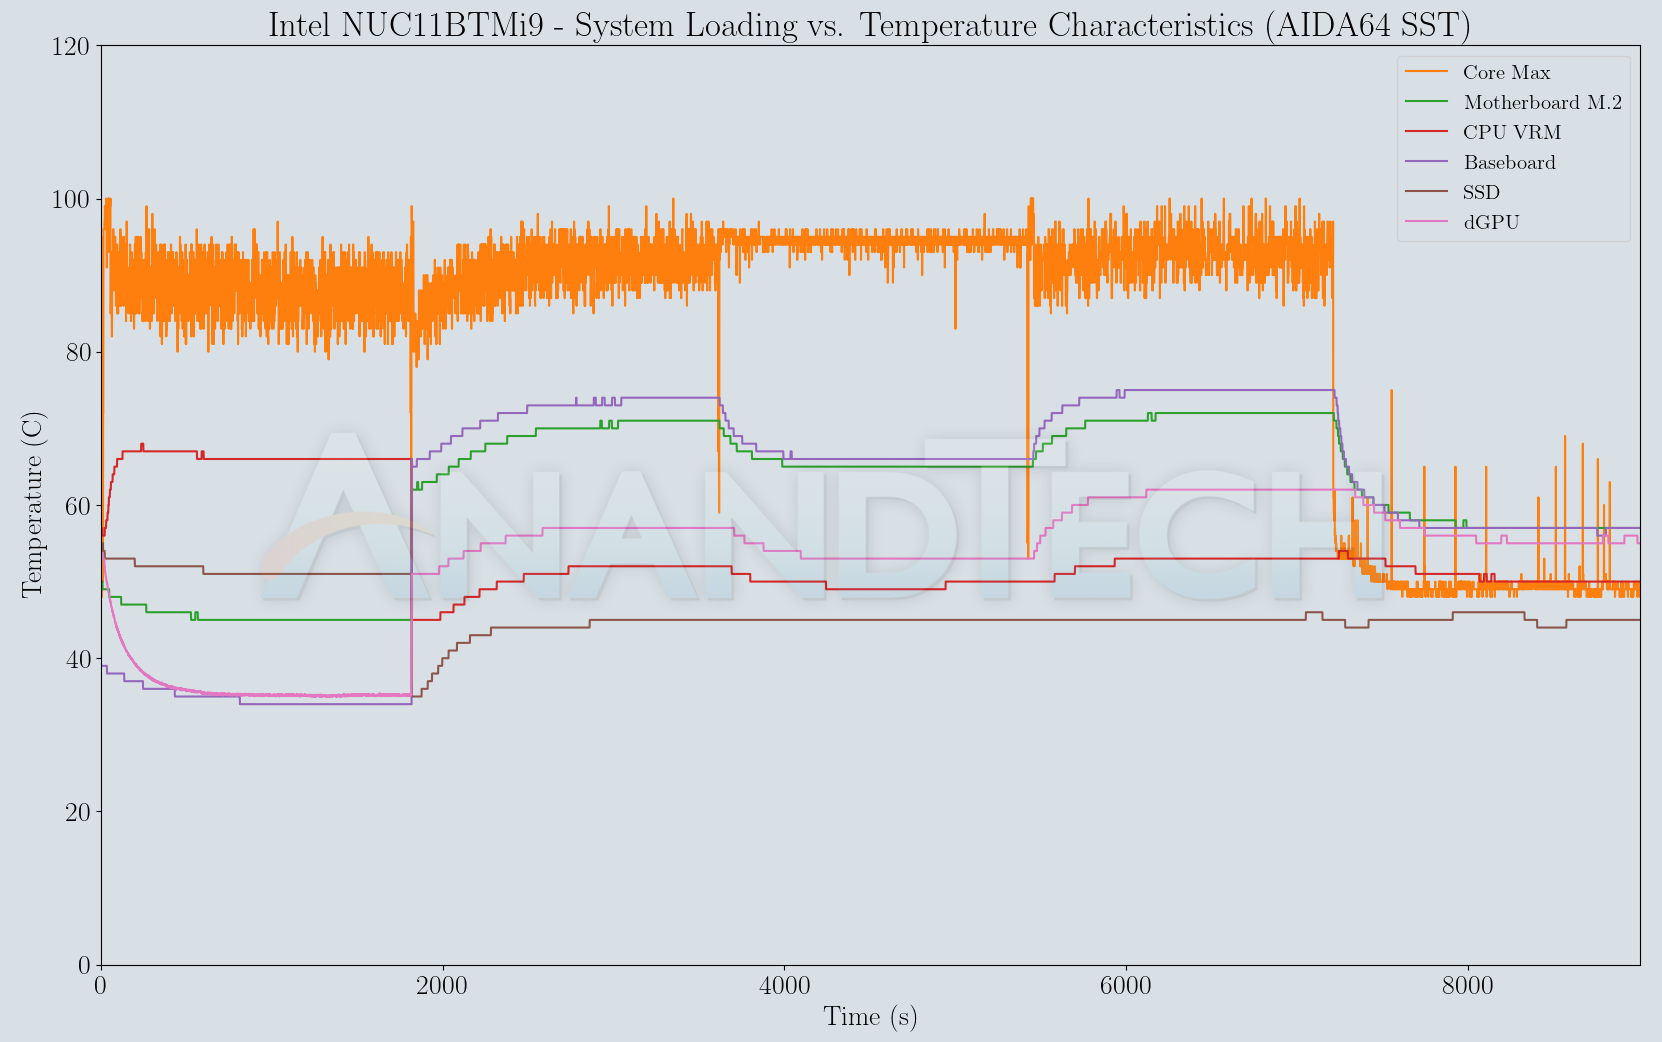
While the CPU package manages to stay below the junction temperature during the system stability test, it does hover very close to the limits. This is likely due to the fans not taking effect soon enough, as the BIOS tries to maintain a balance between noise levels and cooling efficiency. It is likely that the production BIOS will need to sacrifice some noise levels for better thermals. Despite significant loading on the SSD, the thermal solution is good enough to keep the temperature below 75C.
A similar test routine is conducted with Prime95 running in maximum power consumption mode for 30 minutes, followed by the addition of a FurMark stress workload for another 30 minutes. After a cumulative run time of a hour, the Prime95 workload is removed, and FurMark allowed to proceed for another 30 minutes. The system is then left idle for another half an hour. The metrics tracked in the AIDA64 SST case are also tracked here.
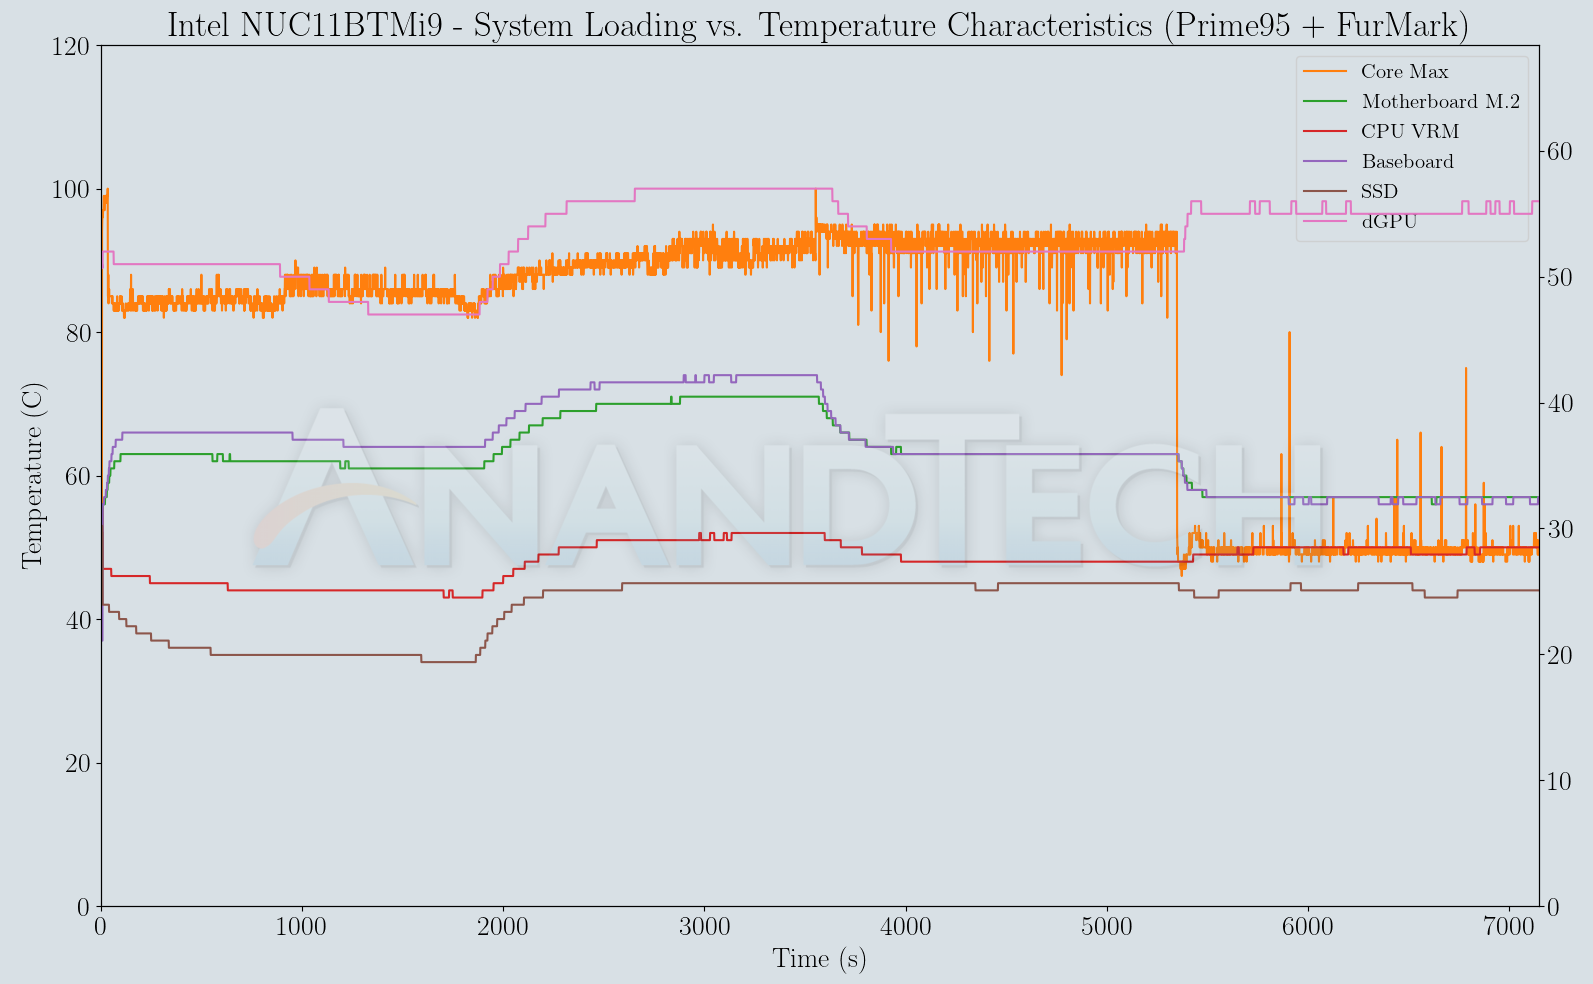

The artificial power virus test significantly amps up the power consumption when both Prime95 and Furmark are simultaneously active. The GPU temperature is also a bit toasty and seems to suffer some after-effects of the Furmark loading. However, the core temperature quickly falls down to around 50C, thanks to the well-ventilated chassis and the three fans on the top panel.
The storage subsystem in the Tiger Lake-based notebooks and PCs presents some interesting aspects. These are the first crop of SFF / battery-powered devices to sport direct CPU-attached PCIe Gen 4 capabilities. The PCMark 10 suite includes a storage benchmark suite. The Sabrent Rocket NVMe 4.0 (directly attached to the CPU) was subject to the 'Full System Drive Benchmark'. Note that there are two sets of graphs below, as we configure a primary and a secondary drive / partition for all evaluated systems. In the case of the Ghost Canyon NUC, the Optane drive was fully allocated as the primary partition. For the Beast Canyon NUC, the drive was partitioned into two - a 180GB OS partition, and a 285GB data partition.
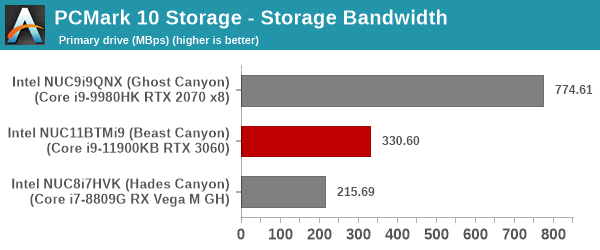
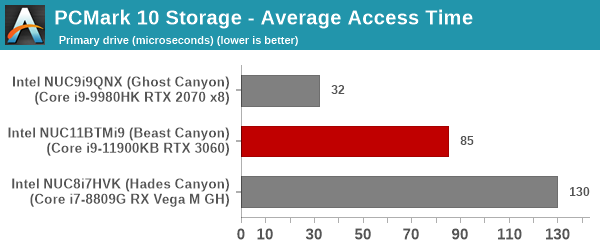
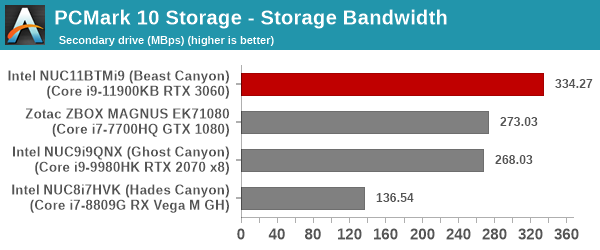
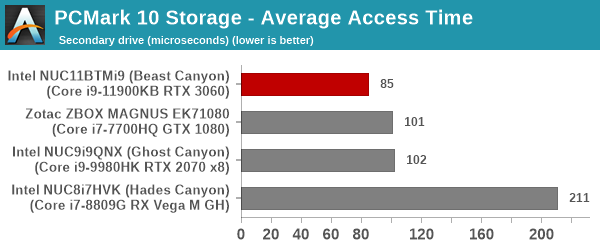
Despite the PCIe 3.0 link, the direct-attached Optane drive in the Ghost Canyon is the top performer by a significant margin in terms of both bandwidth and average access time for real-world applications. In the secondary drive shootout between NAND flash-based SSDs, the PCIe 4.0 link helps the Sabrent Rocket NVMe 4.0 emerge as the leader.
The Beast Canyon NUC brings two important updates on the networking front. The Wi-Fi 6E capability enabled by the Intel AX210 allows wireless access over the 6GHz spectrum that is not subject to as much interference as the 5GHz and 2.4GHz ones. The wired side also receives a boost with 2.5G BASE-T support. The dual LAN capability present in the Ghost Canyon NUC has unfortunately been done away with. That said, the presence of Thunderbolt 4 ports with hub capabilities offers a lot of flexibility to end users. There are many Thunderbolt 4 docks and hubs in the market with such added features.
One of the aspects usually covered in detail in our SFF PC reviews relates to the usage of the system as a HTPC. Being a full-blow gaming desktop, it is unlikely for the Beast Canyon NUC to be used solely as a home-theater PC. The system manages to play back 4K content in multiple different codecs, and YouTube / Netflix UHD content play flawless without dropped frames. However, its noise profile and power consumption numbers do not make it effective or efficient for such tasks. We do plan to evaluate the HTPC capabilities of the Tiger Lake platform in a future piece (with one of the low-power NUCs). That said, if there is enough reader interest, we can do a similar analysis for the Ampere GPU in SFF systems such as the Beast Canyon NUC.
Closing Thoughts
Coming to the business end of the review, Intel's Beast Canyon NUC (NUC11BTMi9) is the latest and greatest performance-oriented mini-PC. The gaming market has been one of the primary drivers of growth in the PC space, and it is no surprise that the Beast Canyon NUC has its sights locked on to that segment. It is a worthy follow-up to last year's Ghost Canyon NUC. In particular, by putting in enough room for a 350W PCIe video card up to 12 inches in length while still retaining a small form factor, Intel has resolved a major issue that had prevented the NUCs from capturing a share of the gaming market. And the inclusion of features such as user-addressable RGB lighting (opinions may be divided on this, but RGB undoubtedly sells) make it all the more attractive for the gaming crowd.
Intel is not alone in trying to make SFF gaming systems attractive to consumers. OEMs like Zotac have been playing in this market for a few years now. The ZBOX E-series MAGNUS line of mini-PCs have slowly moved forward from MXM-type GPUs to full-blown discrete ones. The MAGNUS ONE announced at the 2021 CES has been shipping for a few months now. That system took cues from the Ghost Canyon NUC, but tweaked things enough to be able to accommodate a proper socketed Comet Lake desktop CPU. It doesn't come with premium features such as Thunderbolt 4 or 2.5G BASE-T support.
To that end, Intel would do well to adopt some of the aspects of the MAGNUS ONE such as a Type-C port in the front panel, avoiding of recessed ports, and a rear panel tuned for good cable management. The MAGNUS ONE also allows for tool-less disassembly to access the internals. The Ghost Canyon and Beast Canyon chassis designs are overly complicated when compared to Zotac's.
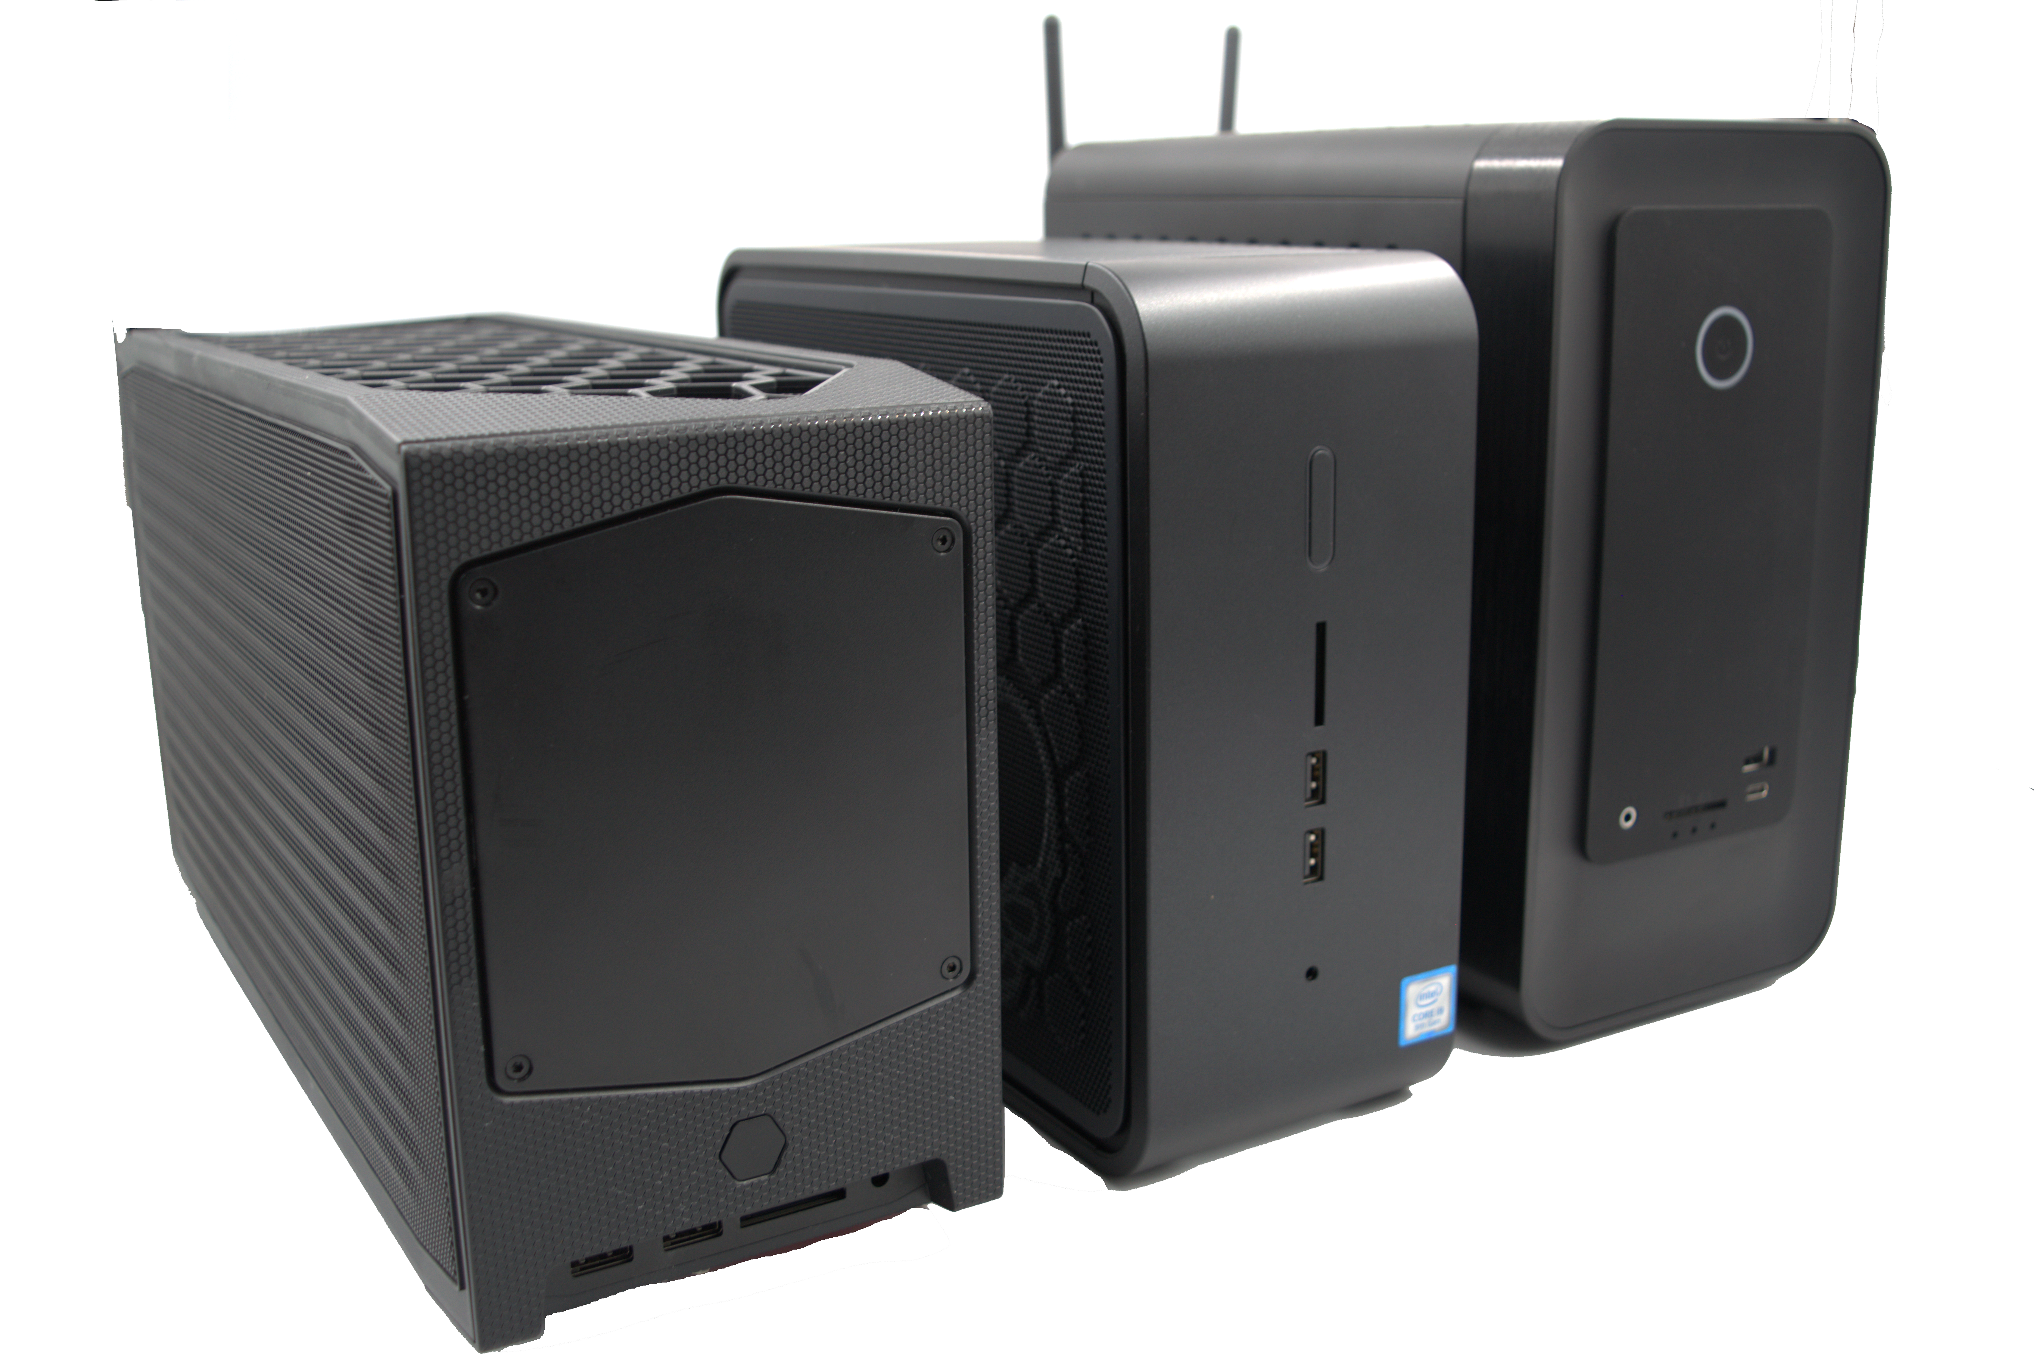
From L to R: Beast Canyon, Ghost Canyon, Zotac ZBOX MAGNUS ONE
The default BIOS configuration used for evaluating the Beast Canyon put it in the maximum performance mode. The PL1 and PL2 values were set for 65W and 109W. In terms of load and idle power consumption, there is not much to differentiate between the Ghost Canyon NUC and the Beast Canyon NUC. However, the benchmark numbers show a clear advantage for the Tiger Lake-enabled Beast Canyon. The BIOS could do with some tweaks to alter the fan curves for better thermals, while also trying to minimize the noise profile.
Overall, the 65W TDP Compute Element is a winner in terms of providing an ideal platform for a SFF gaming desktop that is powerful, yet power-efficient. The Monster Cove baseboard, though, leaves a bit on the table. The change in the location of the non-M.2 PCIe x4 slot and the need to use an air guide for the Compute Element may cause issues in certain use-cases that require and utilize a x8/x4/x4 PCIe bifurcation configuration. Moving the M.2 22110 slot to the underside is worth appreciating, though.
As for the Beast Canyon chassis, the build and appearance are suitable for the target market. Compared to other designs, third-party cases for the Driver Bay Compute Elements such as Akasa's Cypher HDB adopt different tradeoffs in terms of size, shape, and weight. They can cater to niches where the Beast Canyon chassis might not be entirely suitable or preferable.
Overall, Intel has been slowly building up a robust ecosystem around the Compute Elements, and with the focus on the gaming market, they should be able to reach economies of scale easily to drive their vision further. One of the complaints about the Ghost Canyon NUC was the pricing aspect. The NUC9i9QNX launched in July 2020 at $1700. The NUC11BTMi9 carries a much more palatable $1350 price tag. The NUC11BTMi7 is expected to be priced at $1150. The Compute Elements themselves are in the $780 - $980 price bracket. Availability of the Tiger Lake NUCs has been a major concern this year. Intel expects the Beast Canyon NUCs to start selling this quarter with broader availability during the holiday season.
https://ift.tt/3zOfWuB
Technology
Bagikan Berita Ini


0 Response to "Intel Beast Canyon NUC Review: Desktop Tiger Lake Debuts in SFF Gaming Powerhouse - AnandTech"
Post a Comment